Fig. 4.
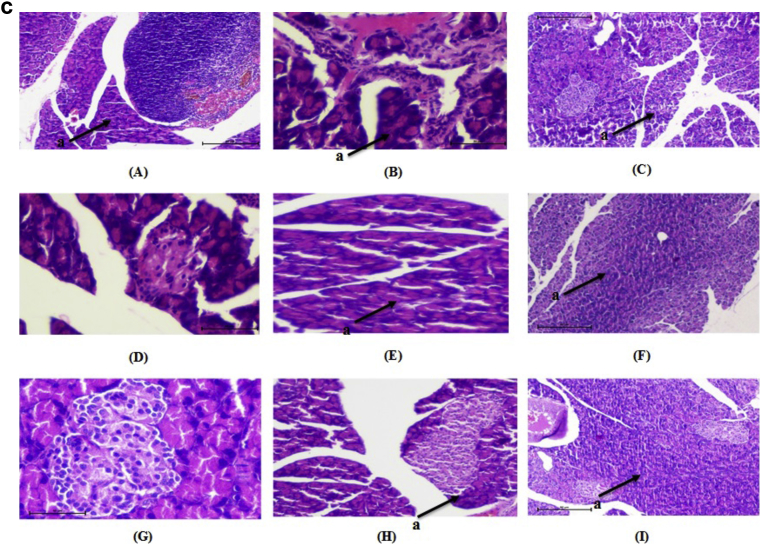
a: Histopathological changes in Kidney of normal and treated rats (H & E 10×). “a” shows the structure of glomerulus. (A) Normal, (B) diabetic nephropathy control, (C) Glimepride 10 mg/kg, (D) DAE 100 mg/kg treated, (E) DAE 200 mg/kg, (F) DAE 400 mg/kg treated, (G), DHE 100 mg/kg treated, (H) DHE 200 mg/kg treated and (I) DHE 400 mg/kg treated. b: Histopathological changes in Liver of normal and treated rats (H & E 10×). “a” shows the structure of central vein in liver. (A) Normal, (B) diabetic nephropathy control, (C) Glimepride 10 mg/kg, (D) DAE 100 mg/kg treated, (E) DAE 200 mg/kg, (F) DAE 400 mg/kg treated, (G), DHE 100 mg/kg treated, (H) DHE 200 mg/kg treated and (I) DHE 400 mg/kg treated. c: Histopathological changes in pancreatic islet of normal and treated rats (H & E 10×). “a” shows the structure of β-cells. (A) Normal, (B) diabetic nephropathy control, (C) Glimepride 10 mg/kg, (D) DAE 100 mg/kg treated, (E) DAE 200 mg/kg, (F) DAE 400 mg/kg treated, (G), DHE 100 mg/kg treated, (H) DHE 200 mg/kg treated and (I) DHE 400 mg/kg treated.


