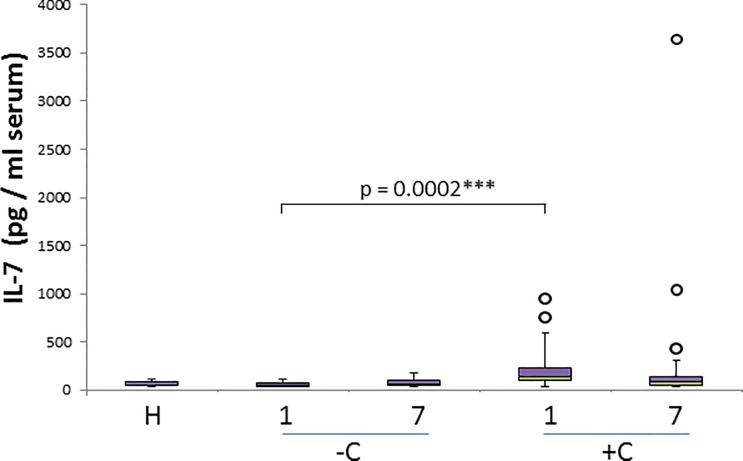
Fig 6. IL-7 concentration in healthy and naturally infected dogs and its relation with outcome.
Box and whisker plot with outliers showing interquartile range (median bar in intersect between two colors in box) of IL-7 concentration values among different groups: healthy dogs (H), uncomplicated (-C) and complicated (+C) cases for both day 1 and day 7. Mann-whitney test p- values are shown for comparison of different groups.

