
Figure 5.
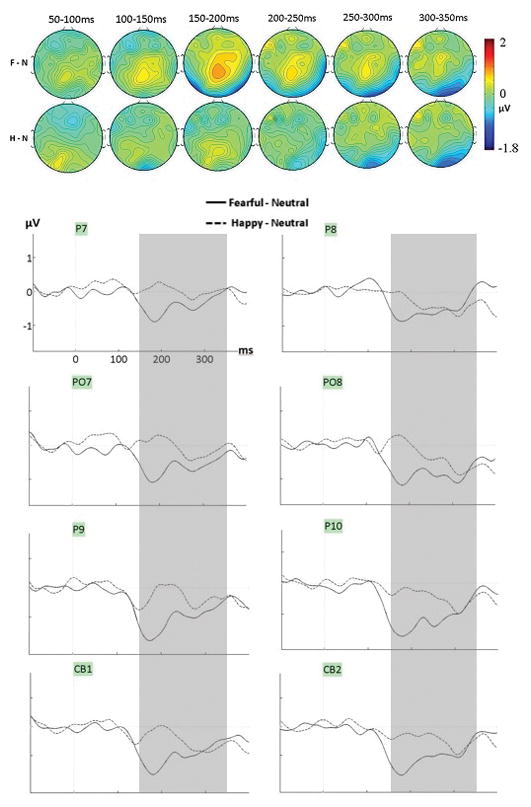
Mean voltage distribution maps (top) and waveforms (bottom) of the group difference waveforms generated by subtracting neutral from fearful and happy conditions (F-N and H-N, averaged across tasks) at lateral-posterior sites (left lateral cluster and right lateral clusters). The grey zone highlights the time during which the effect for fear was significant (150–350ms).