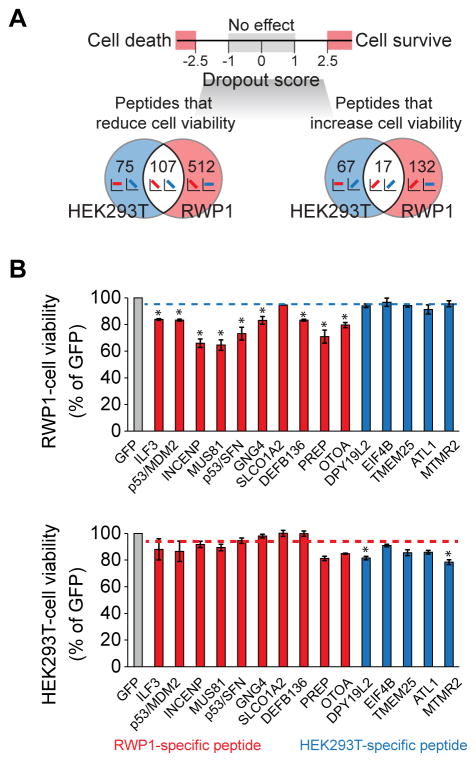
Figure 2. Identification and experimental validation of cancer-specific inhibitors.
(A) Venn diagram of identified peptides leading to dropout/increase specifically in RWP1 (cancer) or HEK293T (normal) cells, or leading to common dropout/increase. (B) Experimental validation of the effect of peptides on cell viability in single-lentivirus infection experiments. Red bars represent cancer (RWP1)-specific peptides and blue bars represent normal (HEK293T)-specific peptides. Blue dashed line indicates average cell viability of HEK293T-specific peptides in cancer (RWP1) cells. Meanwhile, red dashed line indicates average cell viability of RWP1-specific peptides in normal (HEK293T) cells. Statistical analysis was performed using Student’s t-test (2-tails) by comparing the cell viability of each RWP1-specific peptide against those of HEK293T-specific peptides (upper panel). Comparison of cell viability of each HEK293T-specific peptide against those of RWP1-specific peptides was also performed (lower panel). * P-value < 0.05. Experiments were done in triplicate. Data represent mean values ± s.d.

