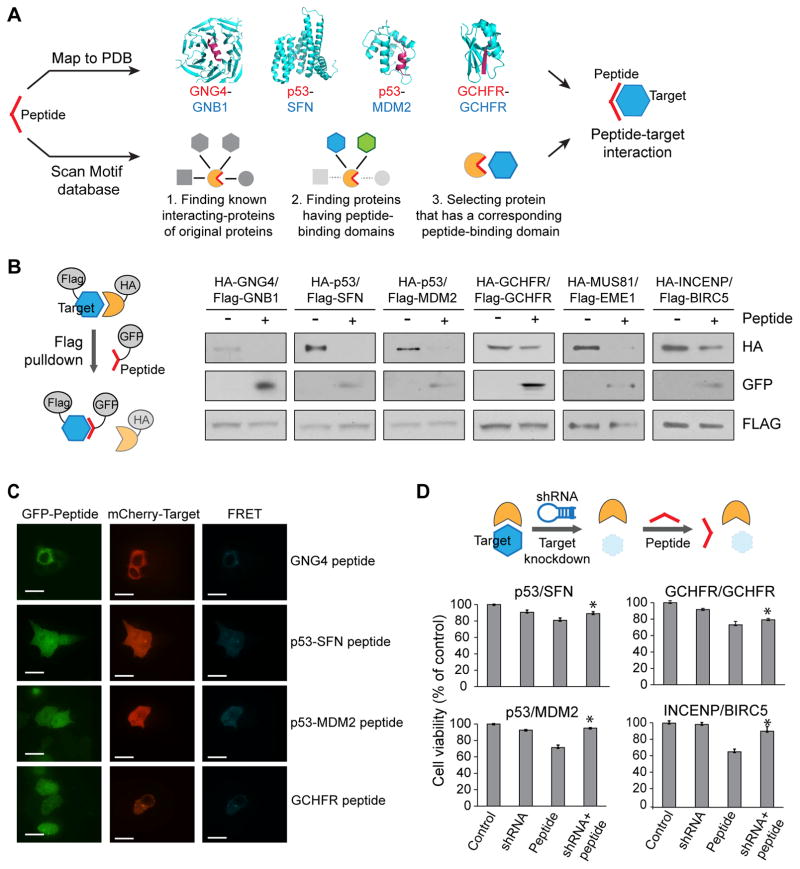
Figure 3. Characterization of peptide-target interactions.
(A) Schematic view of the identification of interactions between peptides and targets. Peptides are either mapped directly to structures of protein interactions in the PDB or are mapped to known domain-motif interactions where both the linear motif and the protein domain involved in the interaction are known. (B) Evaluation of peptide-induced disruption between target and source protein in pulldown experiments. In all four tested cases, the expression of the peptide leads to disruption of the interaction. Also, the peptide is pulled down by its putative binding partner. Experiments were done in triplicate. Full gel images in Supplementary Fig. 11. (C) FRET assay for the determination of binding of peptides to targets. Strong FRET signal is seen, indicating direct in vivo interactions between the peptide and its putative binding partner. White scale bars represent 15 μm. (D) shRNA-induced cell viability rescue experiment. Cell viabilities are measured with cells stably expressing shRNA or transfected with the peptide. For the rescue experiment, cells stably expressing shRNA are transfected with the peptide. * P-value < 0.05. Experiments were done in triplicate. Data represent mean values ± s.d.

