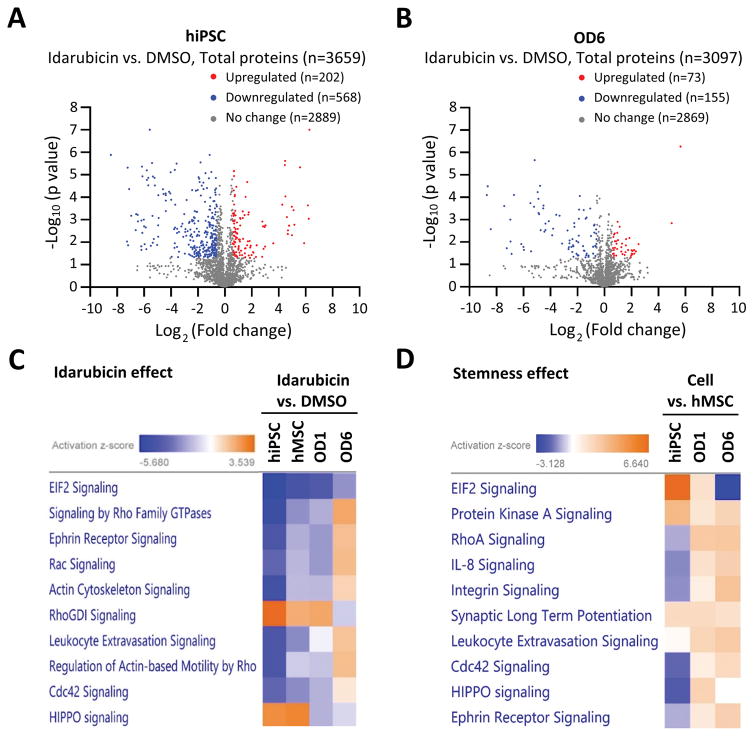
Figure 4. Proteomics studies of pathways and networks involved in toxicity responses to idarubicin.
A. Volcano-plot of differentially-expressed proteins in hiPSCs in response to 24-hour idarubicin treatment. Fold change > 1.5 or < 0.67, and p value < 0.05 were considered significant. Red dots: upregulated proteins after idarubicin treatment (n=202); blue dots: downregulated proteins after idarubicin treatment (n=568); grey dots: proteins with non-significant changes after idarubicin treatment (n=2,889). A total of 3,659 proteins were quantified in this proteomics assay.
B. Volcano-plot of differentially-expressed proteins in hMSCs-OD6 in response to 24-hour idarubicin treatment. Fold change > 1.5 or < 0.67, and p value < 0.05 were considered significant. Red dots: upregulated proteins after idarubicin treatment (n=73); blue dots: downregulated proteins after idarubicin treatment (n=155); grey dots: proteins with non-significant changes after idarubicin treatment (n=2,869). A total of 3,097 proteins were quantified in this proteomics assay.
C. The top canonical pathways enriched after 24-hour idarubicin treatment in different cells (hiPSCs, hMSCs, OD1 and OD6 cells). The activation Z-score indicates either activation (yellow) or inhibition (blue).
D. The top canonical pathways enriched due to the stemness effect. Comparisons were made between hiPSCs and hMSCs, and between basal hMSCs and OD1 and OD6 cells, respectively. The activation Z-score indicates either activation (yellow) or inhibition (blue).

