
Figure 4. MacroH2A1.2 protects from RS-induced DNA damage.
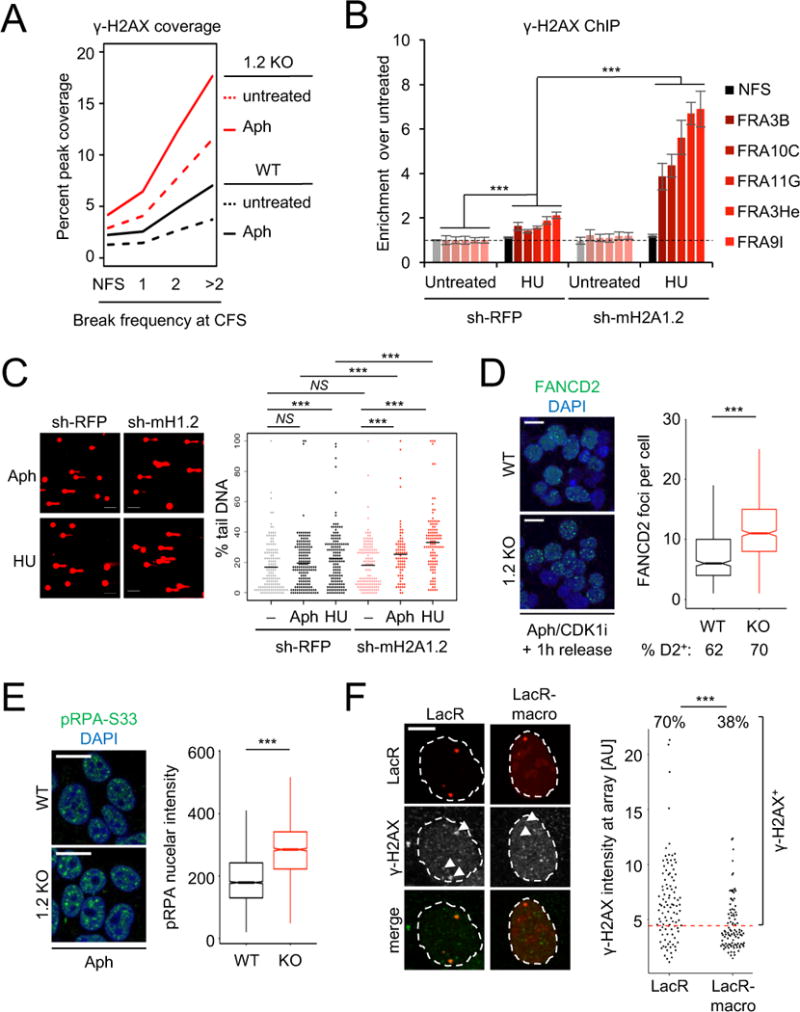
(A) Peak coverage of γ-H2AX within CFSs in macroH2A1.2 WT or KO K562 cells in the presence or absence of Aph. CFSs are partitioned by break frequency (see Fig. 1F). (B) ChIP analysis for γ-H2AX in presence or absence of HU in macroH2A1.2 knock-down and control K562 cells. Values are expressed as mean and SEM (n = 3). “*** p < 0.001 based on Student’s two-tailed t-test. (C) Comet assay assessing DNA damage following HU or Aph treatment in the presence or absence of macroH2A1.2 KD. Percent tail DNA for each cell is shown, black bars represent the mean. *** denotes p < 0.001 by Student’s two-tailed t-test. Scale bar: 100 μM. (D) IF analysis of FANCD2 foci in WT (n = 917 cells) or KO K562 cells (n = 1156 cells) treated with 0.3 μM Aph for 16 h, arrested in late G2 by CDK1 inhibition (CDK1i) and released for 1 h prior to analysis. Representative images are shown. Cells were combined from three independent experiments. The fraction of cells with 1 or more FANCD2 foci is indicated (% D2+). Box plots depict the number of foci in FANCD2+ cells, whiskers extend to 1.5 × the interquartile range (IQR), values outside of the 1.5 IQR are not shown. Scale bar: 20 μm. (E) IF analysis of pRPA-S33 in 293T cells treated with 0.3 μM Aph for 16 h. Box plots depict total pRPA-S33 nuclear intensities in WT (n = 2917 cells) or KO cells (n = 1968 cells). Representative images are shown, cells were combined from three independent experiments. Scale bar: 20 μm. (F) γ-H2AX IF at LacO arrays upon tethering of LacR-macro or LacR alone. The percentage of γ-H2AX+ foci was determined based on total γ-H2AX intensity at the array, data were combined from three independent experiments. Scale bar: 10 μm. *** in (D-F) denotes p < 0.001 by Mann-Whitney U test.