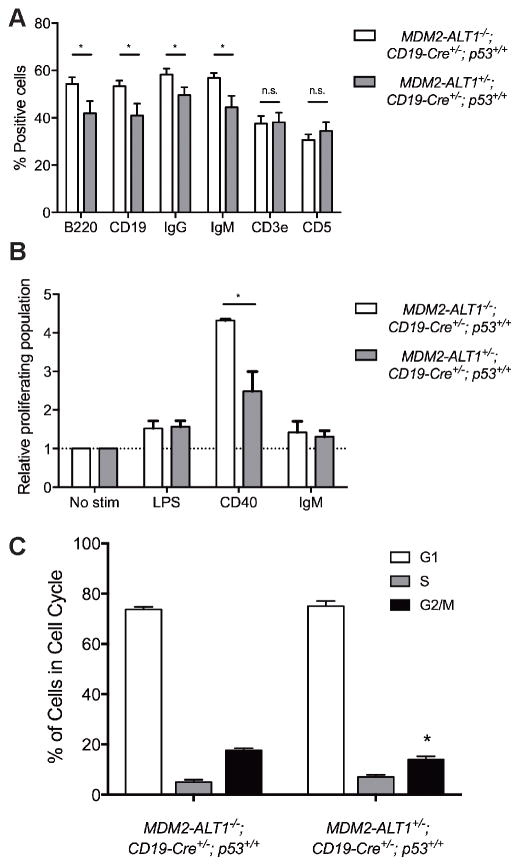
Figure 7. Transgenic mice expressing MDM2-ALT1 in B cells show significantly reduced populations of cells with B cell markers and defects in proliferation in spleens compared to controls.
A. Spleens of age-matched control (MDM2-ALT1−/−; CD19-Cre+/−; p53+/+) and experimental (2C12-MDM2-ALT1+/−; CD19-Cre+/−; p53+/+) mice were harvested at 18 months and the splenocytes were stained for B cell markers CD19, B220, IgG or IgM or T cell markers CD3e or CD5. Compared to MDM2-ALT1-negative control mice (n = 18) the MDM2-ALT1-positive experimental (n = 15) mice showed a statistically significant decrease in the population of cells expressing B cell markers but no changes in T cell population. B. Splenocytes isolated from control (n = 4) and experimental (n = 5) mice were labeled with a fluorescence marker, CFSE, and stimulated for 72 hours with lipopolysaccharides (LPS), CD40 ligand, or anti-IgM molecules. When stimulated with CD40, the MDM2-ALT1 expressing experimental cohort showed a significantly lower proliferative response compared to splenocytes from control mice. The proliferating population was measured by gating for cells displaying low CFSE fluorescence intensity, indicative of dilution of the dye upon cell division. The percent proliferating population from each group was normalized to the respective non-stimulated control set (No stim). * indicates p < 0.05 in all cases as determined by Two-tailed Student’s T test and error bars represent the standard error of the mean. C. Splenocytes from both control (MDM2-ALT1−/−; CD19-Cre+/−; p53+/+, n = 6) and experimental (MDM2-ALT1+/−; CD19-Cre+/−; p53+/+, n = 7) mice were isolated and stained for B cell (B220) and T cell (CD3e) markers, as well as a live/dead discriminator. Cells were then either fixed and stained for propidium iodide and analyzed by flow cytometry. B cells from experimental mice showed a significant reduction of cells in G2/M phase as to controls (p = 0.0435). * indicates p < 0.05 in all cases as determined by Two-tailed Student’s T test and error bars represent the standard error of the mean.

