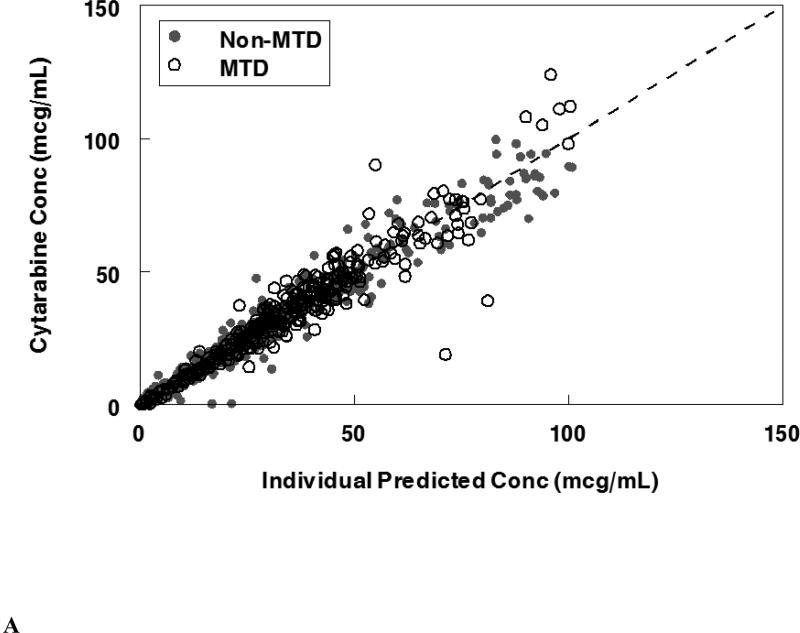
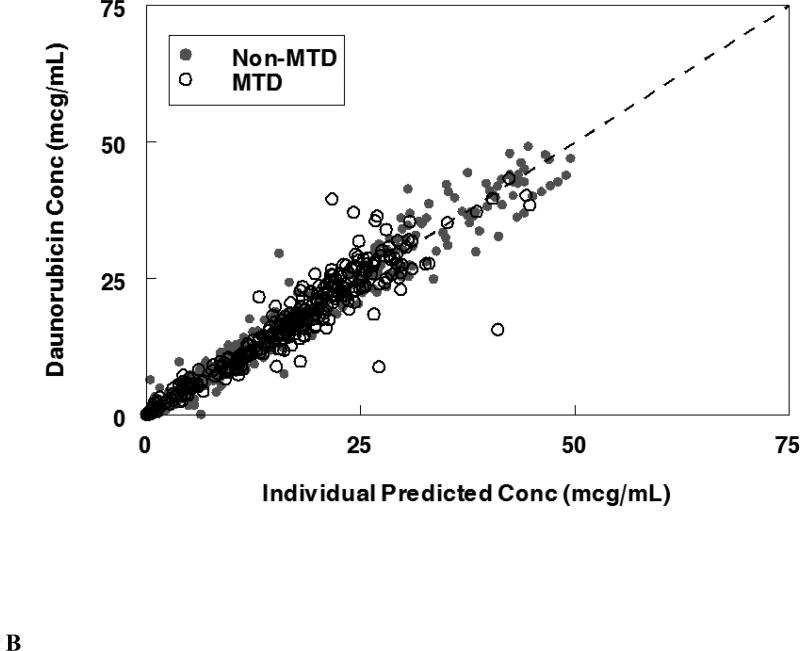
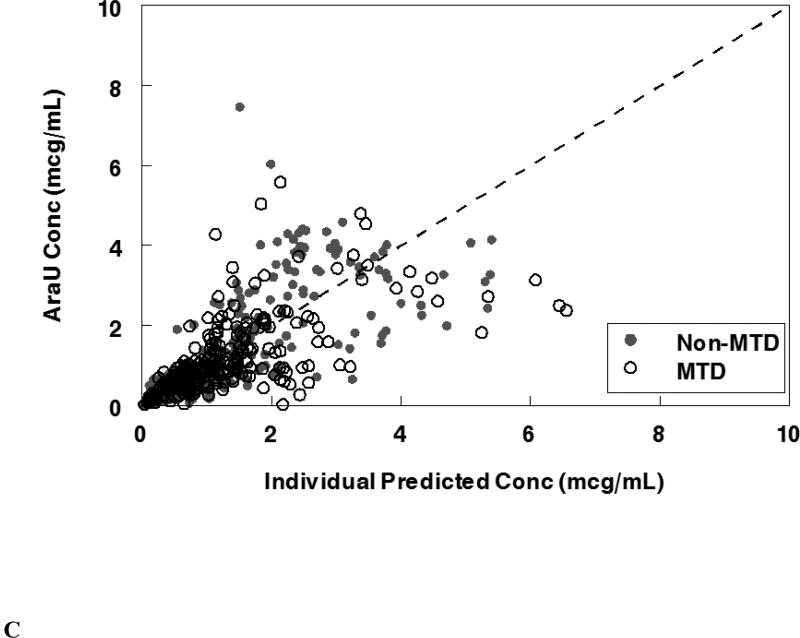
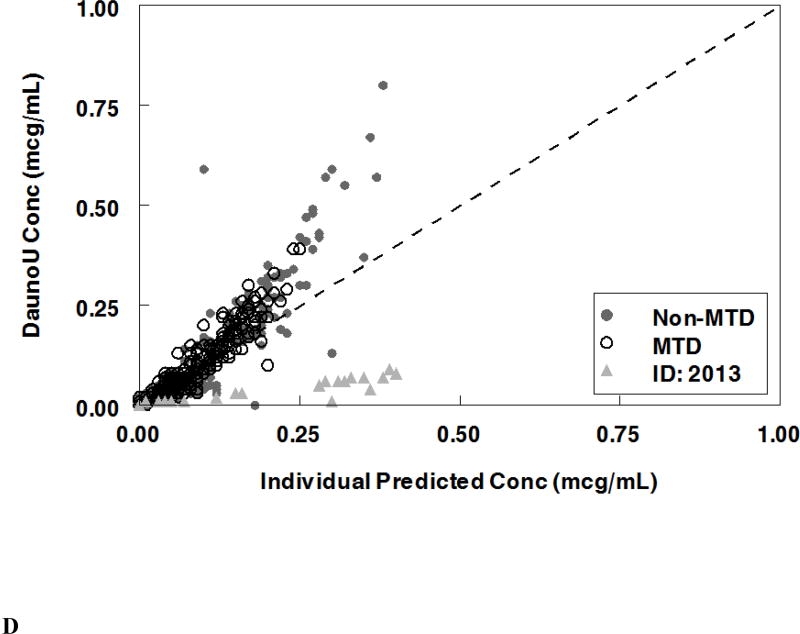
Figure 2.
Population pharmacokinetic final model. Individual predictions were compared to observed concentrations in the study for: A. Liposomal cytarabine, B. Liposomal daunorubicin, C. Uracil arabinoside (araU, cytarabine metabolite), and D. Daunorubicinol (daunoU, daunorubicin metabolite). Open black circles represent the maximum tolerable dose of 101 units/m2 while other doses are represented by solid gray circles. One subject made minimal daunoU metabolite (ID: 2013) and was denoted by gray triangles.


