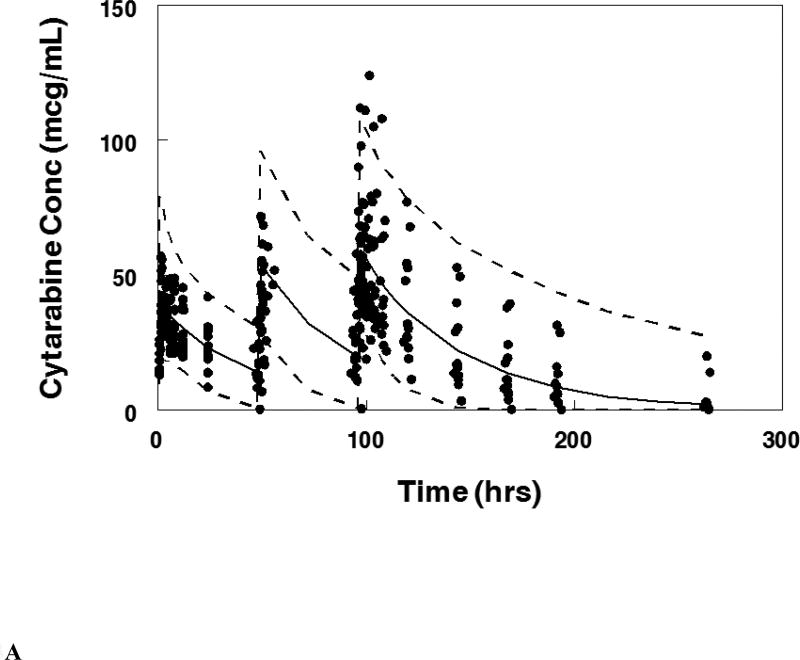
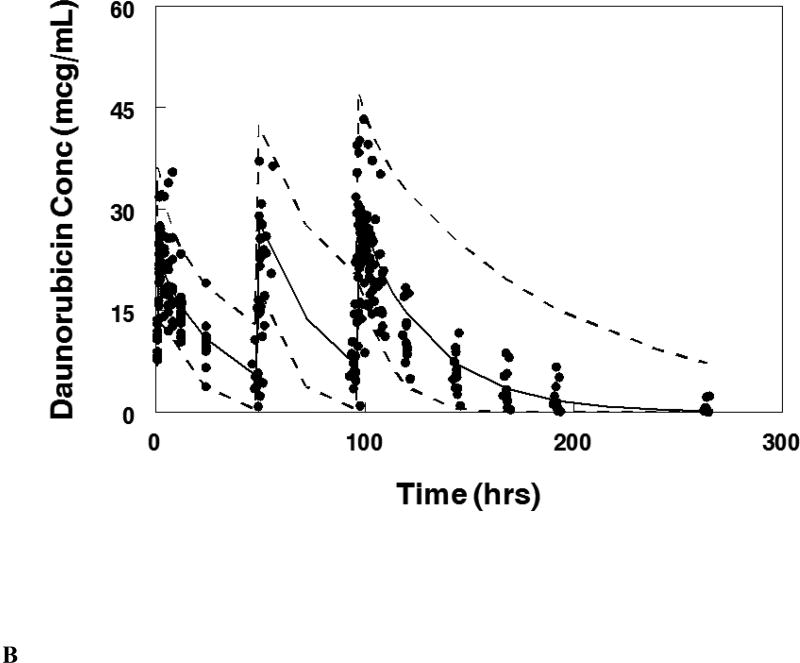
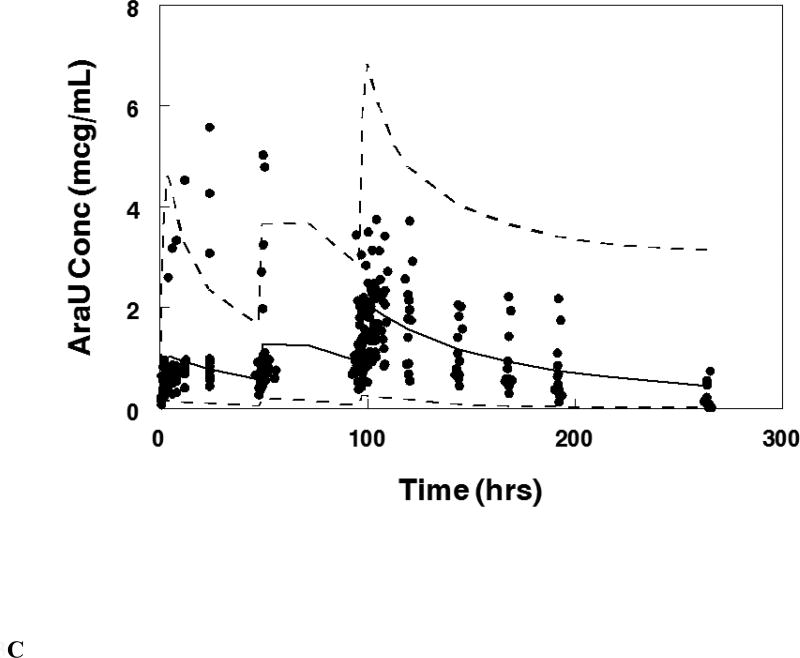
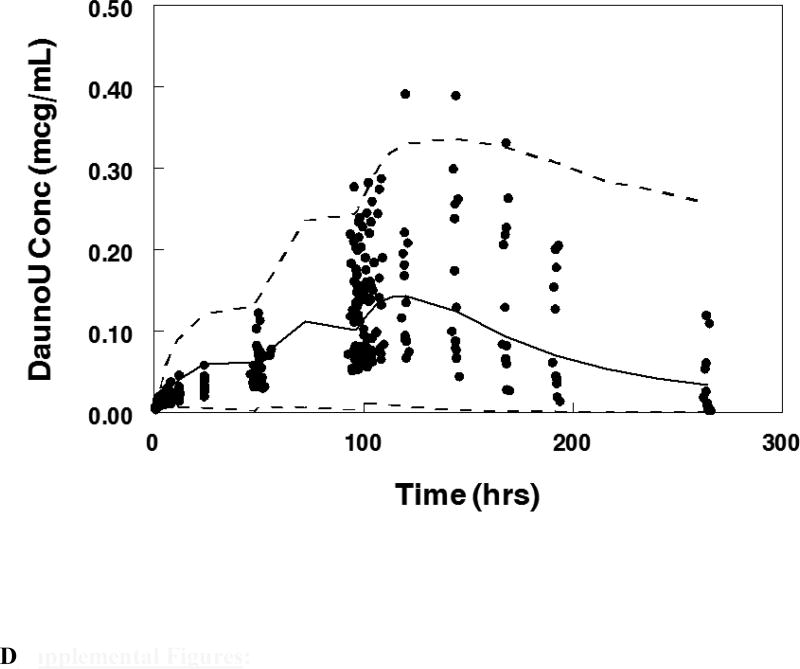
Figure 3.
Visual predictive plot for the population pharmacokinetic model with concentration data from patients treated on the maximum tolerable dose of 101 units/m2 for: A. Cytarabine, B. Daunorubicin, C.Uracil arabinoside (araU, cytarabine metabolite), and D. Daunorubicinol (daunoU, daunorubicin metabolite). Solid line represents median and dashed lines represent the 2.5 and 97.5 percentiles from the Monte Carlo simulation of the final model.


