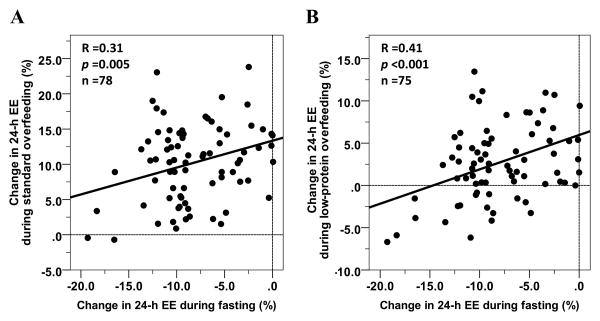
Figure 2. Relationships between the 24-h EE responses to fasting and overfeeding with a standard (Panel A) and with a low-protein (Panel B) diets.
The percentage change in 24-h EE during each dietary intervention was calculated as the difference between the 24-h EE during the dietary intervention and the 24-h EE during energy balance, divided by the 24-h EE during energy balance and expressed as a percentage [28]. Data from the #NCT00523627 study registered at ClinicalTrials.gov.

