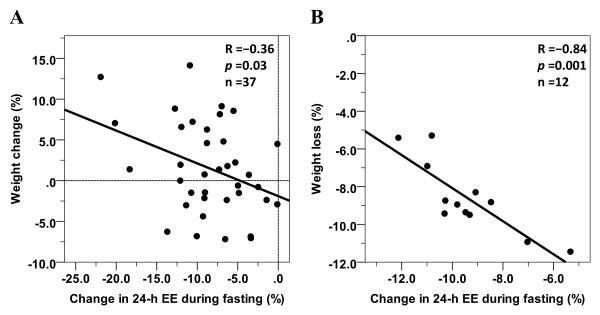
Figure 3. Inverse relationships between 24-h EE change with fasting and 6-month body weight change in free-living conditions (Panel A, [28]) and weight loss after 6 weeks of caloric restriction on a clinical inpatient unit (Panel B, [29]).
The percentage change in 24-h EE during each dietary intervention was calculated as the difference between the 24-h EE during the dietary intervention and the 24-h EE during energy balance, divided by the 24-h EE during energy balance and expressed as a percentage. Weight change/loss is expressed as absolute change in body weight divided the baseline weight and expressed as a percentage.

