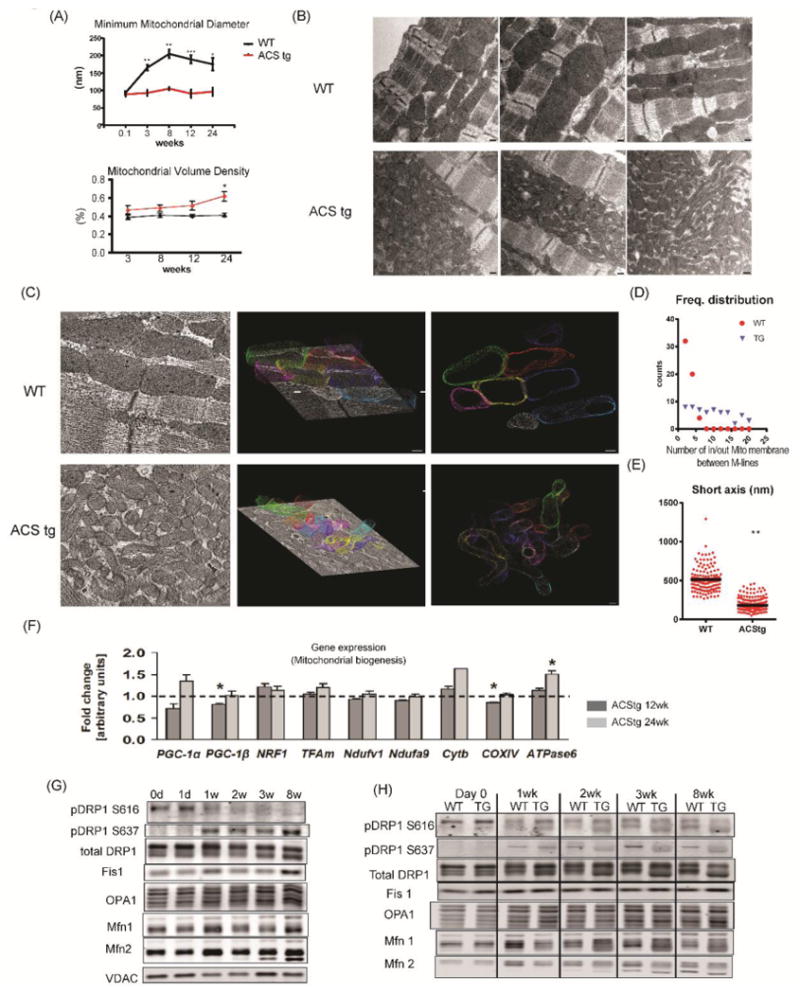
Figure 3. Mitochondrial fragmentation in ACStg hearts.

(A) Postnatal mitochondrial enlargement was attenuated in ACStg hearts. Stereologic quantification of mitochondrial minimum diameter and volume density was performed at the ages as indicated in 2-D electron micrographs (EM) presented in Online Fig.III A. ; n =3-4. * P<0.05, ** P<0.01, *** P<0.001. (B) Representative electron micrographs of longitudinal sections of WT and ACStg cardiomyocytes at the age of 8weeks, 3 hearts per genotype. Scale bars indicate 200nM. (C-E) Representative electron tomographic micrographs and corresponding 3D models of the mitochondrial network. Scale bars indicate 100nM (C). Number of mitochondrial outer membranes transitioned on a straight line trajectory between M-lines of two neighbouring myofilament bundles, counted in 22 (WT) and 26 (ACStg) electron tomograms (3 hearts per genotype) (D). Short axis diameter was measured in 132 (WT) and 290 (ACStg) mitochondria of 22 (WT) and 26 (ACStg) electron tomograms from 3 hearts per genotype; ** P <0.01(E). (F) Myocardial gene expression in 12- and 24-week-old WT and ACStg mice normalized to 16S RNA transcript levels. Values represent fold change in mRNA transcript levels relative to WT, which was assigned as 1 (dashed line), n=8 *; P<0.05 vs WT. (G) Western blot of whole heart lysates probed with antibodies as indicated at postnatal ages as shown. d=day, w=week. See also Online Fig.IV A. Each sample at 0d, 1w and 3w was isolated more than 3 times and immunoblotted separately, and each sample at day1, 2w and 8w was repeated twice. A representative western blot is shown. (H) Western blot of whole heart lysates from WT and ACStg mice probed with antibodies as indicated and harvested at the ages shown. See also Online Fig.IV B. All data are mean ± sem. Each sample at day0, 1wk and 3wk was isolated more than 3times and immunoblotted separately, and each sample at 2wk and 8wk was repeated twice. A representative western blot is shown.
