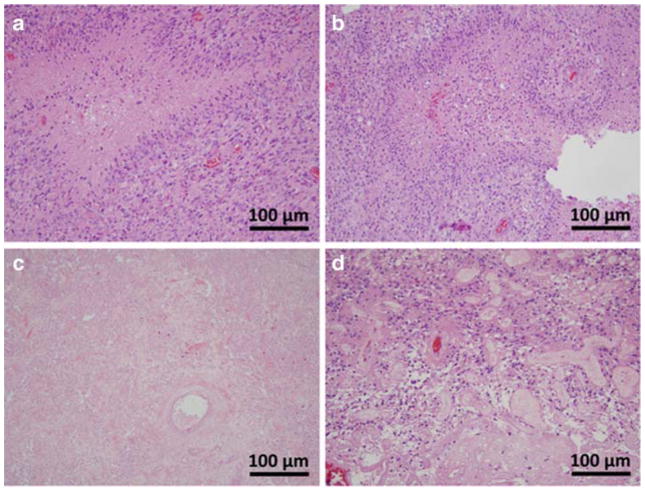
Figure 2.
Representative H&E histology staining in tissue samples from CRT-treated (A, C, D) and treatment naïve (B) patients. Shown are samples of pure GBM (A, B), pure TE (C), and GBM admixed with TE (D). The sample of GBM admixed with TE is shown to illustrate non-pure samples which were excluded from analysis. The samples of pure GBM (A, B) contain all of the same characteristic features regardless of treatment status.

