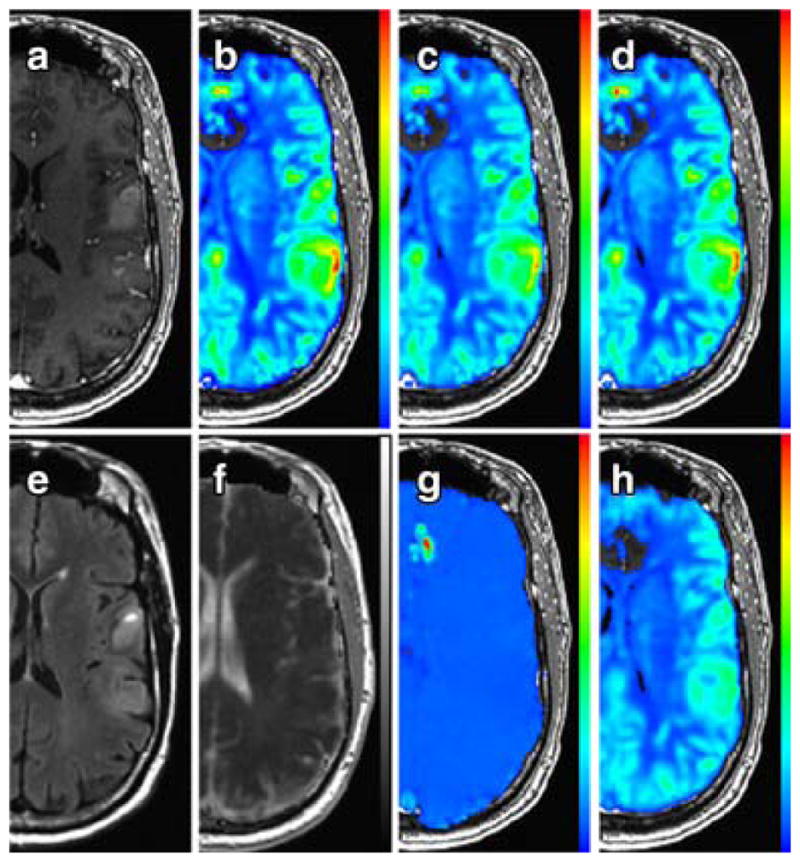
Figure 3.

Example parameter maps in a 61-year-old male with GBM. Shown are post-contrast SPGR (A), sRCBV (B), nRCBV (C), nCBF (D), FLAIR (E), ADC (F), PSR (G), and PH (H). Perfusion parameter maps are overlaid on post-contrast SPGR. ADC is overlaid on FLAIR. Noticeable in the PSR image is the absence of tumor contrast compared to other tissue, which occurs when a preload dose of contrast agent is administered for the purpose of reducing T1-related leakage effects in the calculation of rCBV.
