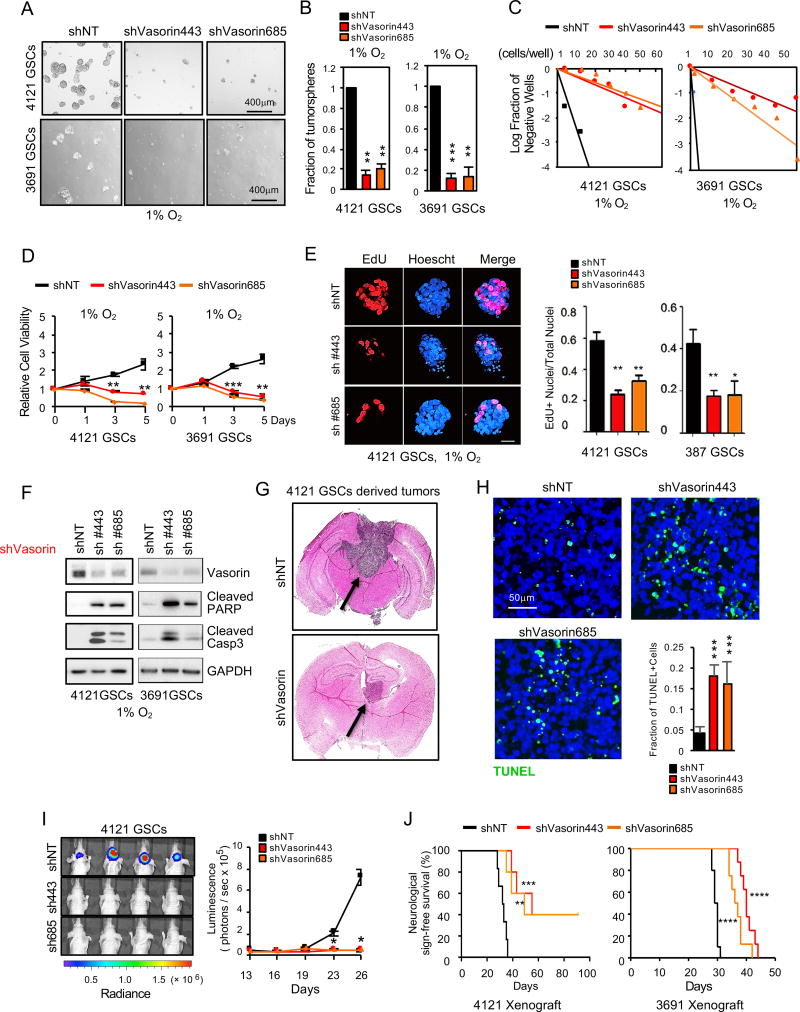
Figure 4. Vasorin Promotes GSC Maintenance and Tumorigenesis.
(A) GSCs (4121 and 3691) were transduced with two different shVasorin sequences and cultured in hypoxia (1% O2) for 5 days and tumorsphere formation was assessed by bright field microscopy.
(B) Quantification of tumorspheres in 2 different GSC lines (4121 and 3691) in hypoxia after Vasorin knockdown.
(C) In vitro limiting dilution assay of GSCs expressing shNT or shVasorin cultured in hypoxia.
(D) Cell viability of GSC lines 4121 and 3691 after Vasorin knockdown and cultured in hypoxia.
(E) IF imaging (left) of EdU incorporation in GSC tumorspheres cultured under hypoxic conditions for 48 hrs. Quantification of the fraction of EdU+ cells (right).
(F) IB analysis of cleaved caspase3 and cleaved PARP proteins in GSCs with Vasorin knockdown cultured under hypoxic conditions.
(G–J) GSCs stably expressing luciferase were transduced with shNT or shVasorin through lentiviral infection and intracranially transplanted into the brains of nude mice (2×10⁴ cells per mouse). (G) Representative images of cross-sections (hematoxylin and eosin stained) of mouse brains 26 days after transplantation. (H) Apoptotic cells in GBM xenografts derived from GSCs expressing shNT or shVasorin were detected in situ using the TUNEL assay. Nuclei were counterstained with DAPI (blue). The apoptotic index was assessed by the ratio of TUNEL-positive cells / total number of cells from eight randomly selected fields. (I) GBM xenografts derived from luciferase-labeled GSCs expressing shNT or shVasorin were tracked by bioluminescence (right). Real-time images from animals on day 26 are shown (left). Error bars represent the mean ± SEM. (J) Kaplan-Meier survival curve of mice implanted with 4121 GSCs (n=6 for each group) or 3691 GSCs (n=8 for each group) expressing shNT or shVasorin. Significance testing by log rank test.
*p < 0.05; **p < 0.01; ***p < 0.001, ****p<0.0001
Data are represented as mean ± SD unless otherwise stated. See also Figure S4.

