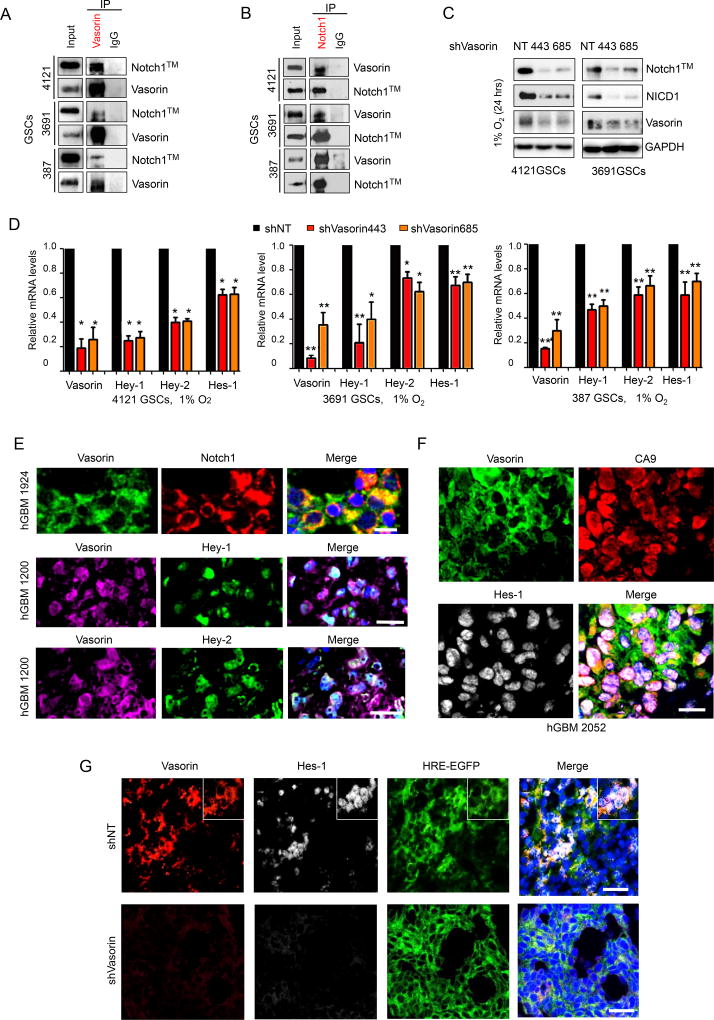
Figure 5. Vasorin Binds to Membranous Notch1 to Facilitate Notch Signaling.
(A–B) Co-immunoprecipitation (Co-IP) of Vasorin (A) or Notch1 (B) in 3 different GSC lines (387, 3691 and 4121) and blotted for Notch1™ and Vasorin. IgG was used as a control antibody for IPs.
(C) IB of Notch1™, NICD1 and Vasorin in GSCs transduced with shNT or shVasorin and cultured in 1% O2 for 24 hours.
(D) qRT-PCR of Notch target genes in GSCs (4121) transduced with shNT or shVasorin.
(E) Top: IF staining of Vasorin (green) and Notch1 (red) in human GBM. Scale bar measures 20µm. Middle: IF staining of Vasorin (purple) and Hey-1 (green) in human GBM. Scale bar measures 50µm. Bottom: IF staining of Vasorin (purple) and Hey-2 (green) in human GBM. Scale bar measures 50µm. Nuclei were counterstained with DAPI (blue).
(F) IF staining of Vasorin (green), CA9 (red) and Hes-1 (gray) in human GBM. Nuclei were counterstained with DAPI (blue). Scale bar measures 50µm.
(G) IF staining of Vasorin (red), Hes-1 (gray) in GBM xenografts derived from GSCs expressing HRE-EGFP and shNT or shVasorin. Nuclei were counterstained with DAPI (blue). Scale bar measures 50µm.
*p < 0.05, **p < 0.01
Data are represented as mean ± SD. See also Table S1 and Figure S5.

