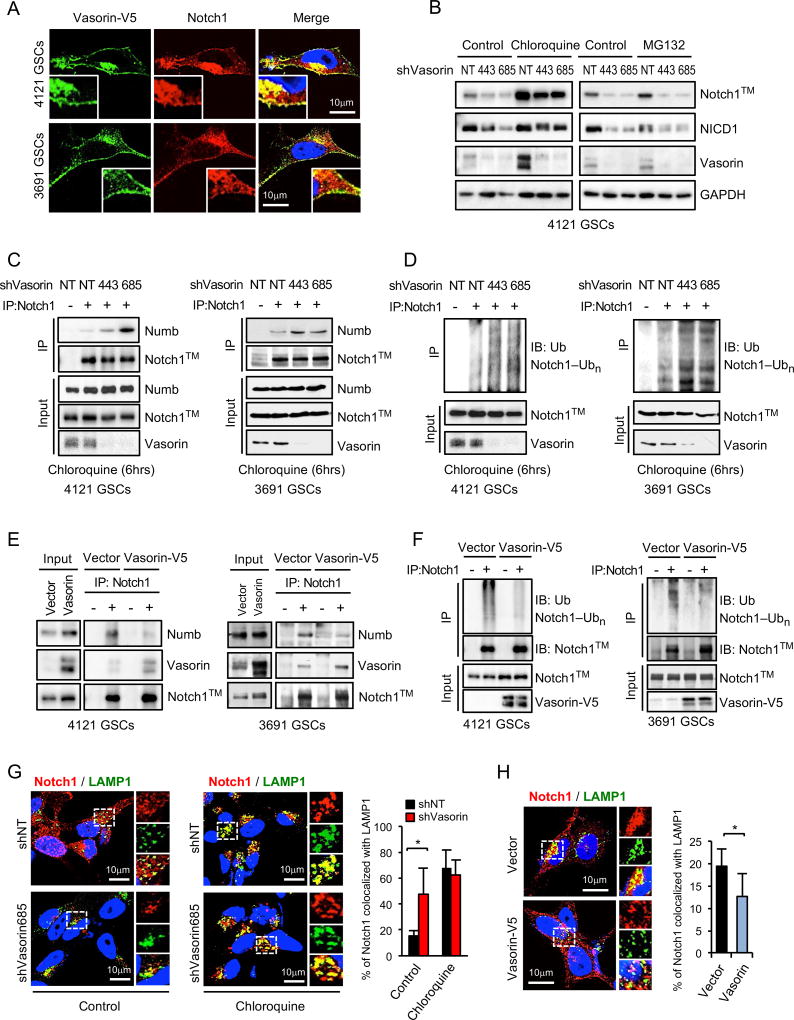
Figure 6. Vasorin Reduces Notch1 Lysosomal Degradation.
(A) Co-IF staining of Vasorin (green) and Notch1 (red) in GSCs with stable expression of Vasorin-V5.
(B) IB analysis of Notch1 and Vasorin in GSCs transduced with shNT or shVasorin, then treated with chloroquine or MG132.
(C–D) GSCs (4121 and 3691) were transduced with shNT or shVasorin and treated with chloroquine for 6 hours before harvest. (C) Cell lysates were immunoprecipitated (IP) with anti-Notch1 antibody and the co-precipitated proteins were analyzed by IB with the indicated antibodies. IgG was used as a control antibody for IPs. (D) Cell lysates were immunoprecipitated with an anti-Notch1 antibody and then immunoblotted with anti-Ubiquitin (Ub) or anti-Notch1 antibody.
(E–F) GSCs (4121 and 3691) were stably transduced with control vector or Vasorin-V5. (E) Co-IP assay was performed as described in (C). IgG was used as a control antibody for IPs. (F) Ubiquitylation of Notch1™ in GSCs overexpressing Vasorin-V5 was performed as described in (D).
(G) Co-IF staining of Notch1 (red) and lysosomal marker LAMP1 (green) in GSCs transduced with shNT or shVasorin and then treated with control chloroquine for 6 hours (left). Quantification of the percentage of Notch1 co-localized with LAMP1 (right).
(H) Co-IF staining of Notch1 (red) and LAMP1 (green) in GSCs stably expressing control vector or Vasorin-V5 (left). Quantification of the percentage of Notch1 co-localized with LAMP1 (right). The co-localized pixels were assessed by ImageJ.
*p < 0.05
Data are represented as mean ± SD. See also Figure S6.

