
Figure 2. DDX3 inhibition results in reduced expression of proteins involved in mitochondrial translation.
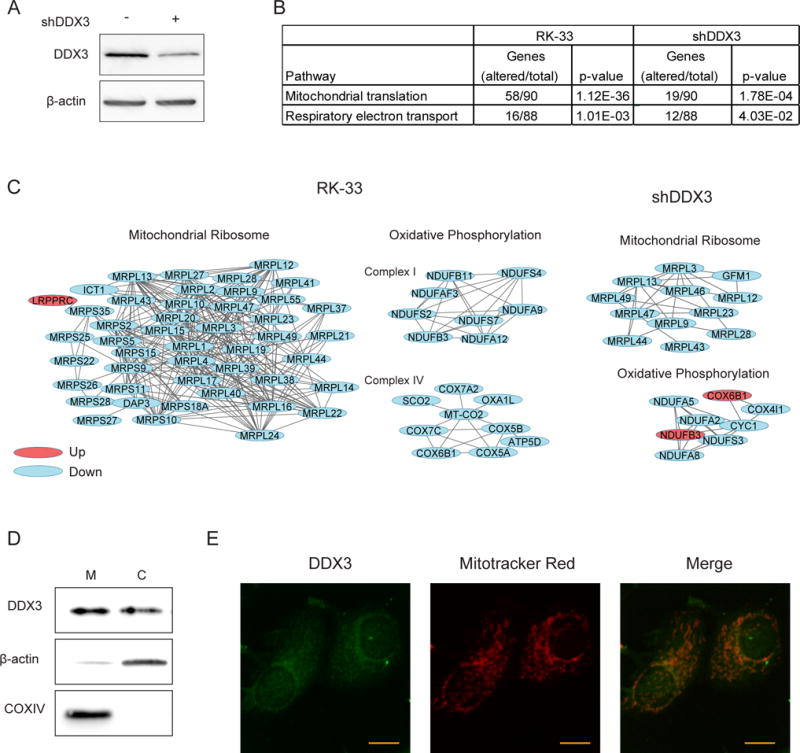
A. Immunoblot showing the DDX3 expression before and after transduction with shDDX3 in MDA-MB-435 cells. B. Table showing two overrepresented Reactome pathways identified by gene set enrichment analysis of significantly altered proteins in MDA-MB-435 cells after 24 hours exposure to 4.5 μM RK-33 or after shDDX3 transduction. C. Protein networks identified by string network analysis in the group of significantly altered proteins explained under B. D. Immunoblot showing the DDX3 expression in mitochondrial (M) and cytoplasmic (C) fractions of MCF7. E. 2-foton microscopy image of MCF7 immunofluorescently stained for DDX3 and labeled with mitotracker red. Scale bar indicates 5 μm. All experiments have been replicated a minimum of two independent times.