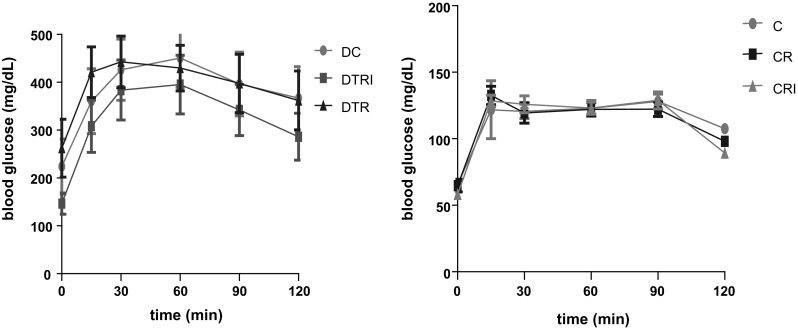
Fig. 1.

Oral glucose tolerance test and area under the curve of serum glucose 30 days after treatment in rats in the diabetic and control groups. Diabetic control (DC, n = 8), diabetic ration + isoflavone (DTRI, n = 8), and diabetic group with a modified ration group (DTR, n = 8), control group (C, n = 8), control group with a modified ration (CR, n = 8), and control group with a modified ration + isoflavones (CRI, n = 8). The differences between the means were determined using ANOVA and Tukey’s test with significance set at p ≤ 0.05. There were no significant differences among the diabetic groups
