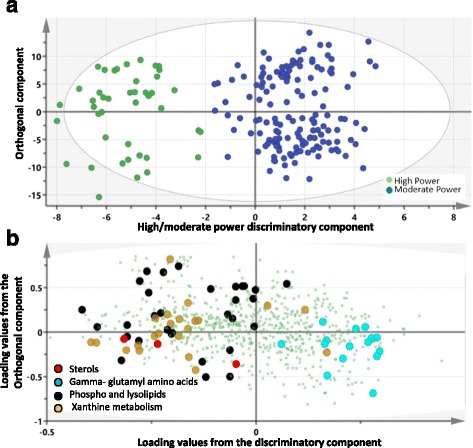
Fig. 3.

OPLS-DA model of moderate- versus high-power classes of elite athletes. a A score plot showing the class-discriminatory component on the x-axis versus the first orthogonal component on the y-axis. b The corresponding loading plot showing a clustering of sterols, lipids, and xanthine metabolites at the high end of power as opposed to enrichment of gamma-glutamyl amino acids at the low end of power
