Fig. 1.
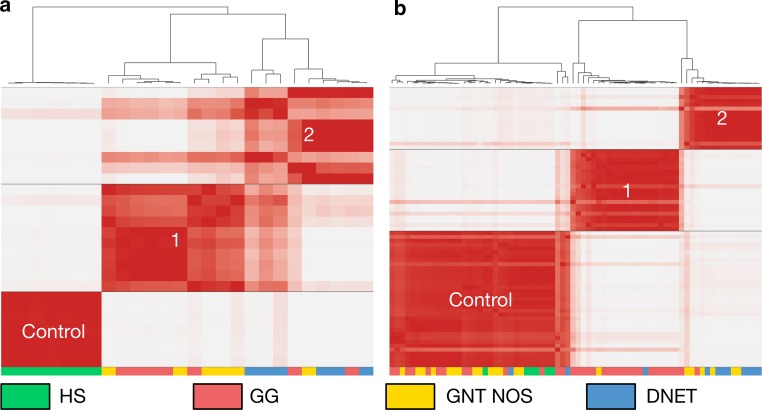
Glioneuronal tumours cluster into two groups, which are only partially consistent with histology, according to their expression and methylation profiles. a Consensus clustering heatmap of 19 tumours (7 GG 6 DNET, 6 GNT NOS) and 7 controls. Cases are clustered according to the top 5000 most variably expressed genes. Group 1 consisted of 5 GG and 5 GNT NOS (n = 10). Group 2 consisted of 2 GG, 6 DNET, and 1 GNT NOS (n = 9). b Clustering heatmap of 65 tumours (34 GG, 11 DNET, 20 GNT NOS) and 6 controls. Cases are clustered according to the top 10,000 most variably methylated CpGs. Group 1 consisted of 19 GG, 1 DNET and 1 GNT NOS (n = 21). Group 2 consisted of 2 GG, 8 DNET, and 6 GNT NOS (n = 16)

