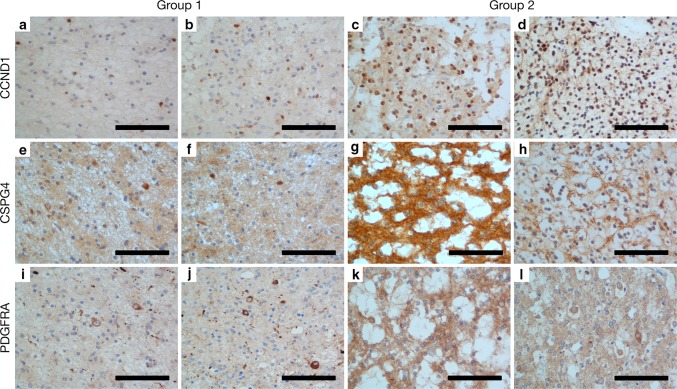
Fig. 4.
Immunohistochemistry against CCND1 (a–d), CSPG4 (e–h), and PDGFRA (i-l) in Group 1 and Group 2 tumours. CCND1 displayed the most striking difference between tumour groups, staining a minority of tumour cells within Group 1 tumours, in contrast to a majority in Group 2 tumours. CSPG4 was more variable between cases within groups and therefore less robust, staining neurons in Group 1 tumours, compared to a proportion of “oligodendrocyte-like” cells and the neuropil in Group 2 tumours. For PDGFRA we observed a thin rim of membranous/cytoplasmic staining in the majority of tumour cells within Group 2 tumours, while only neurons were stained in Group 1 tumours. Scale bars = 100 μm

