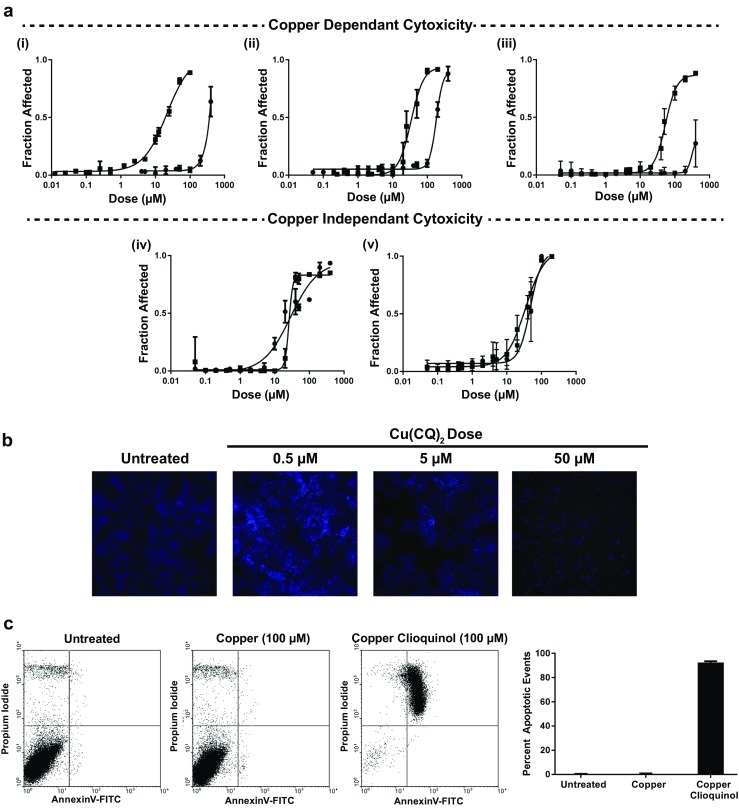
Fig. 1.

The cytotoxicity of Cu(CQ)2 in cancer cell lines. a Cytotoxicity curves for CQ (-●-) and Cu(CQ)2 (-■-) were obtained for (i) A2780-S, (ii) A2780-CP, (iii) A549, (iv) U251, and (v) MV-4-11 cells. Cells were seeded for 24 h and then treated with CQ or Cu(CQ)2 at doses ranging from 0.05–400 μM for 72 h. Cell viability for the adherent cell lines (A2780-S, A2780-CP, A549, U251) was determined using an INCell analyzer 2200, where viability was assessed based on loss of plasma membrane integrity 72 h following treatment, i.e., total cell count and dead cell count were determined using Hoechst 33342 and ethidium homodimer staining, respectively. The viability of the non-adherent cell line (MV-4-11) was measured using PrestoBlue™. Data is presented as mean ± SEM, where the values were determined in triplicate three times. b Representative cell micrograph images of untreated or Cu(CQ)2 treated (0.5–5 μM) A2780-CP cells stained with Hoechst 33342. c A2780-CP cells untreated or treated with copper sulfate (100 μM) or Cu(CQ)2 (100 μM) were incubated with Annexin V-FITC and PI. Stained cells were analyzed using flow cytometry, wherein the upper left quadrant shows only PI positive cells, which are necrotic, and lower left quadrant shows viable cells. The lower right quadrant shows Annexin positive cells (early apoptotic) and upper right quadrant shows Annexin and PI positive cells (late apoptosis). The percentage apoptotic events (early and late) were included in a histogram
