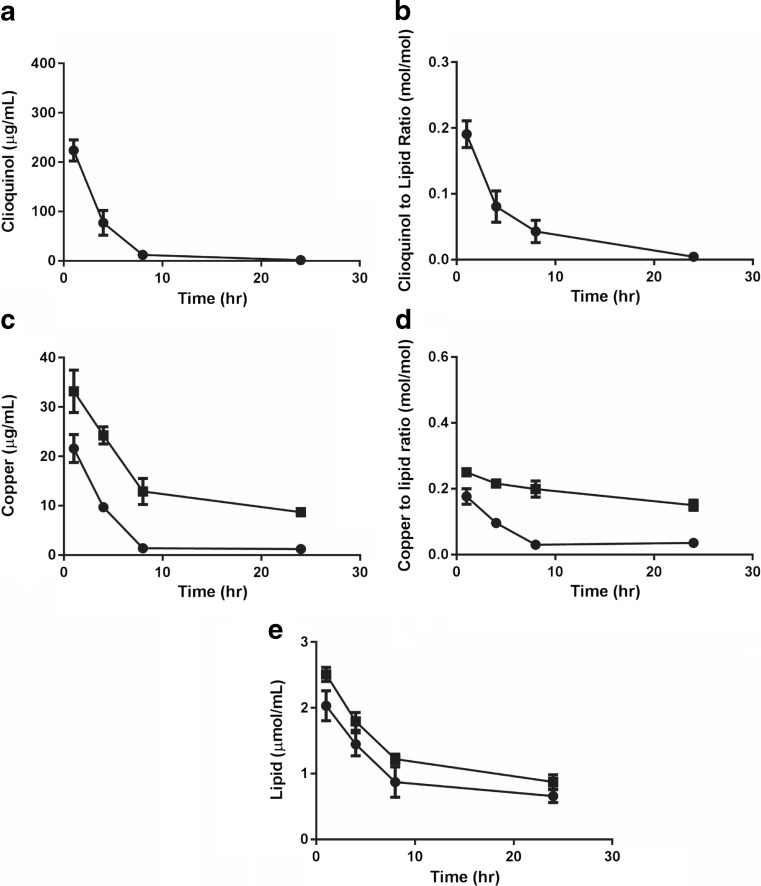
Fig. 3.
Cu(CQ)2 and copper liposome plasma elimination following intravenous injection in CD-1 mice. The Cu(CQ)2 liposomes (30-mg/kg CQ, 3.2-mg/kg Cu, 115.6-mg/kg lipid) were dosed in CD-1 mice. Copper liposomes (liposomes prepared in 300-mM CuSO4) were injected at the same copper and liposomal lipid dose of 3.2 and 115.6 mg/kg, respectively. a CQ plasma concentration over 24 h, where CQ was measured by HPLC methods. b CQ to liposomal lipid ratio over 24 h following administration of the Cu(CQ)2 formulation. c Plasma copper levels following injection of Cu(CQ)2 (●) and copper liposomes (■) over 24 h, where Cu2+ was measured using AAS (see “Materials and methods”). d Copper to liposomal lipid ratio measured over 24 h following injection of copper liposomes or the Cu(CQ)2 formulation. e The liposomal lipid concentration was measured using scintillation counting of 3H-CHE. All data are plotted as mean ± SEM (n = 5), if error bars are not seen they are within the size of the symbol used

