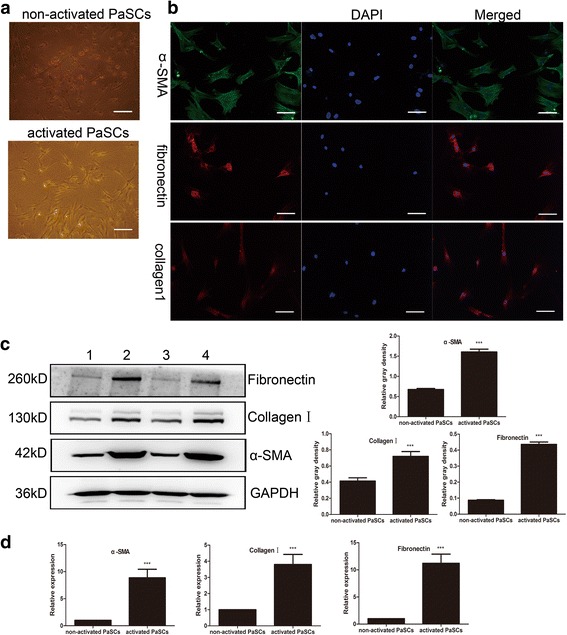
Fig. 2.

Culture and identification of primary mouse PaSCs. a Representative oil red O staining in mouse non-activated and activated PaSCs. b Immunofluorescence staining of α-SMA, collagen I and fibronectin in mouse PaSCs. Nuclei were counterstained with DAPI. c Representative western blotting images showing the α-SMA, collagen I and fibronectin expression in non-activated and activated PaSCs; densitometry analyses of the blots are also shown (groups 1 and 3 represent non-activated PaSCs; groups 2 and 4 represent activated PaSCs). d Representative RT-qPCR results showing the α-SMA, collagen I and fibronectin mRNA expression in non-activated and activated PaSCs. Scale bars: 50 μm in (a) and (b). The data are presented as the mean ± SD. ***P < 0.001; n = 4; (t-test); Student’s t-test
