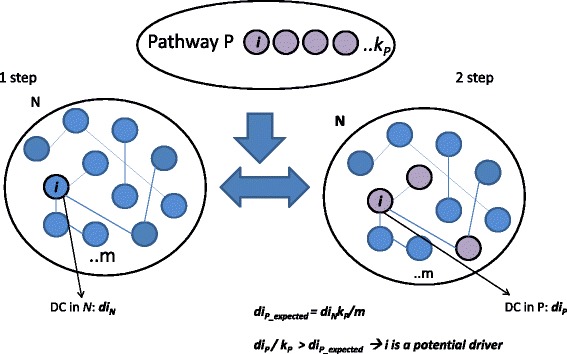
Fig. 1.

The computational approach. The first step involves a network N (e.g. physical interaction) of size m and for each gene, i in N the algorithm calculates its degree centrality, DC (diN). The second step involves a list of functional pathways (e.g. pathway P) and for each gene i, the DC (dip) is calculated using the information on interacting genes from N. For the assumption of equal probability for existing edges between nodes, the algorithm calculates the expected DC of gene i in the pathway P. If the DC observed for the gene i (dip) is higher than expected (dip_expected), i could be a potential driver in the pathway P
