
Fig. 2.
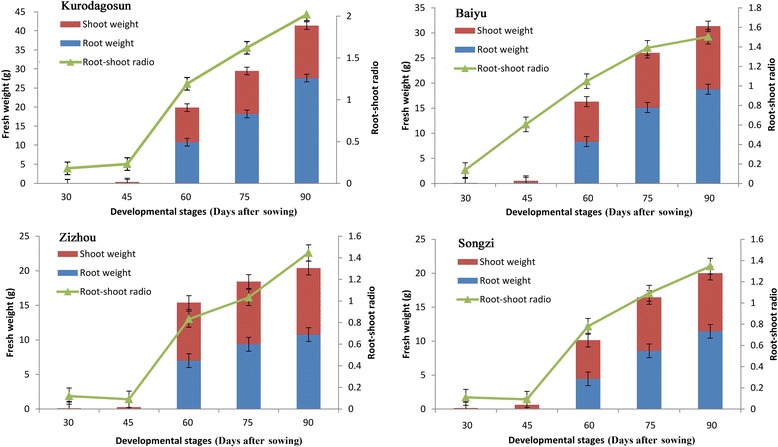
Characteristics of fresh weight of root (blue columns) and shoot (red columns) and root-shoot ratio (green triangles) in carrot. The five developmental stages were stage 1 (30 DAS), stage 2 (45 DAS), stage 3 (60 DAS), stage 4 (75 DAS), and stage 5 (90 DAS). Error bars represent standard deviation among three independent replicates. Data are means of three replicates ± SD