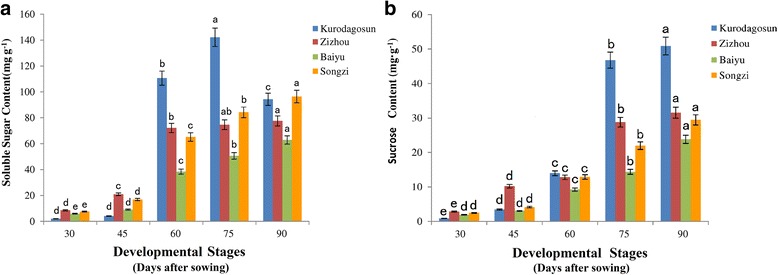
Fig. 4.

Determination of soluble sugar level and sucrose content in four carrot cultivars at five developmental stages. The soluble sugar content was shown in (a) and sucrose content was shown in (b). The five developmental stages were stage 1 (30 DAS), stage 2 (45 DAS), stage 3 (60 DAS), stage 4 (75 DAS), and stage 5 (90 DAS). Error bars represent standard deviation among three independent replicates. Data are means of three replicates ± SD. Different lowercase letters indicate significant differences at P < 0.05
