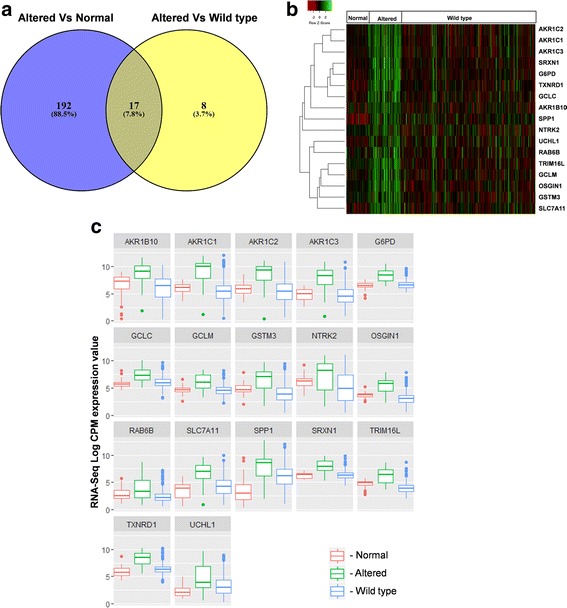
Fig. 3.

Identification of expression signature of genes regulated by KEAP1-NRF2-CUL3 axis in TCGA-HNSCC. a Venn diagram of overlapping genes from both altered versus normal and altered versus wild-type upregulated gene analysis in HNSCC. b Hierarchical clustering of normal, altered, and wild-type cases showing the specific expression pattern of the 17-gene signature. Green, relatively high expression; red, relatively low expression. c Box plots of 17-gene signature illustrating significant differences of expression in normal, altered, and wild-type cases. X-axis, RNA-Seq V2 log CPM (counts per million) values
