Fig. 4.

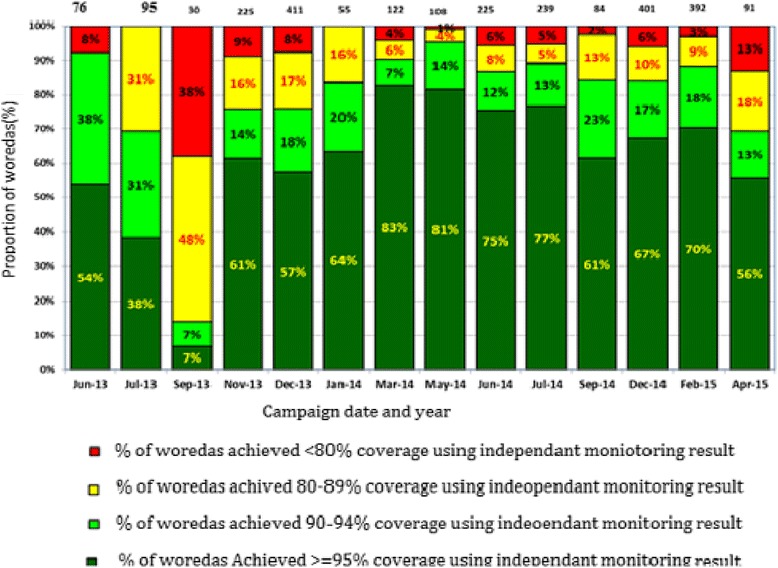
Woredas performance during Polio SIAs, 2013–2015, Ethiopia. Remarks: The number on top of the graph is the number of Woredas assessed during independent monitoring

Woredas performance during Polio SIAs, 2013–2015, Ethiopia. Remarks: The number on top of the graph is the number of Woredas assessed during independent monitoring