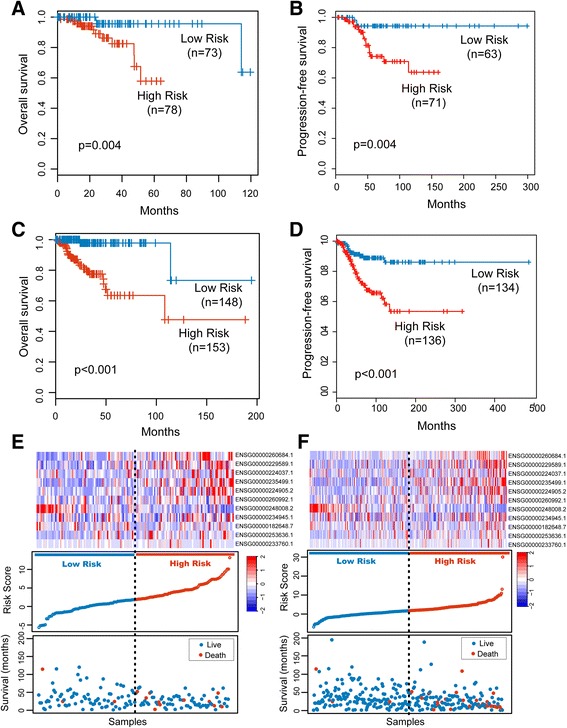
Fig. 2.

Independent validation of the lncRNA signature. Kaplan-Meier curves for overall survival of patients classified into high- and low-risk groups using the lncRNA signature in the validation cohort (a) and in the entire TCGA cohort (c). Kaplan-Meier curves for progression-free survival of patients classified into high- and low-risk groups using the lncRNA signature in the validation cohort (b) and in the entire TCGA cohort (d). The distribution of risk score, patients’ survival status and lncRNA expression pattern for high-risk and low-risk patients in the validation cohort (e) and in the entire TCGA cohort (f)
