Fig. 4.

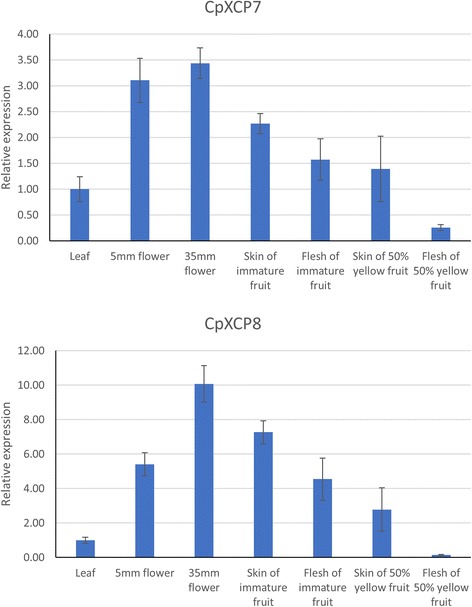
Quantitative Real-time PCR result of CpXCP7 and CpXCP8 across different tissues. Bar graph shows relative CpXCP7 and CpXCP8 gene expression in seven different tissues. Their expression in leaf tissue was chosen to be calibrator

Quantitative Real-time PCR result of CpXCP7 and CpXCP8 across different tissues. Bar graph shows relative CpXCP7 and CpXCP8 gene expression in seven different tissues. Their expression in leaf tissue was chosen to be calibrator