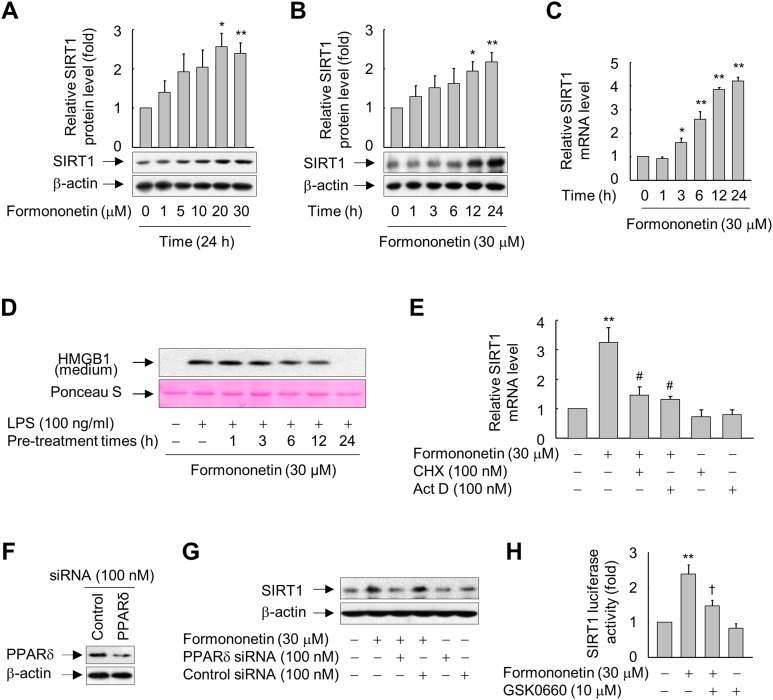
Figure 2. Involvement of PPARδ in formononetin-mediated upregulation of SIRT1 in RAW264.7 cells.
(A, B) Cells cultured in serum-free medium for 16 h were incubated with various concentrations of formononetin for 24 h (A) or with 30 mM formononetin for the indicated durations (B). Aliquots of whole-cell lysates were analyzed by immunoblotting. Representative blots are provided. Fold changes in the SIRT1/β-actin ratio relative to that in the untreated group are shown as mean ± SE (n = 3). (C) Cells cultured in serum-free medium for 16 h were stimulated with formononetin for the indicated durations. After incubation for 24 h, total RNA was isolated and the levels of SIRT1 mRNA were analyzed by real-time PCR. The results are expressed as the mean ± SE (n = 3). (D) Cells maintained in serum-free medium for 16 h were pre-treated with formononetin for indicated times. Following washing with fresh medium, the cells were stimulated with LPS for 24 h. Equal volumes of conditioned media were analyzed by immunoblotting. Ponceau S staining was used as the loading controls. (E) Cells cultured in serum-free medium for 16 h were incubated with CHX or Act D in the presence or absence of formononetin. After incubation for 24 h, total RNA was isolated and the levels of SIRT1 mRNA were analyzed by real-time PCR. The results are expressed as the mean ± SE (n = 3). (F) Cells were transfected with siRNA against PPARδ or control and grown for 38 h. The cells were then lysed and aliquots of whole-cell lysates were subjected to Western blot analysis. (G) Cells transfected with PPARδ-targeting or control siRNA for 38 h were stimulated with formononetin for 24 h. Aliquots of whole-cell lysates were analyzed by immunoblotting. (H) Cells transfected with 1 μg of the SIRT1 luciferase reporter plasmid and 0.5 μg of pSV b-Gal for 38 h were pretreated with GSK0660 for 30 min and then exposed to formononetin for 24 h. Luciferase activity was normalized to β-galactosidase activity. The results are expressed as the mean ± SE (n = 3). *p < 0.05, **p < 0.01 compared with the untreated group; #p < 0.05 compared with the LPS-treated group; †p < 0.05 compared with the formononetin-treated group.

