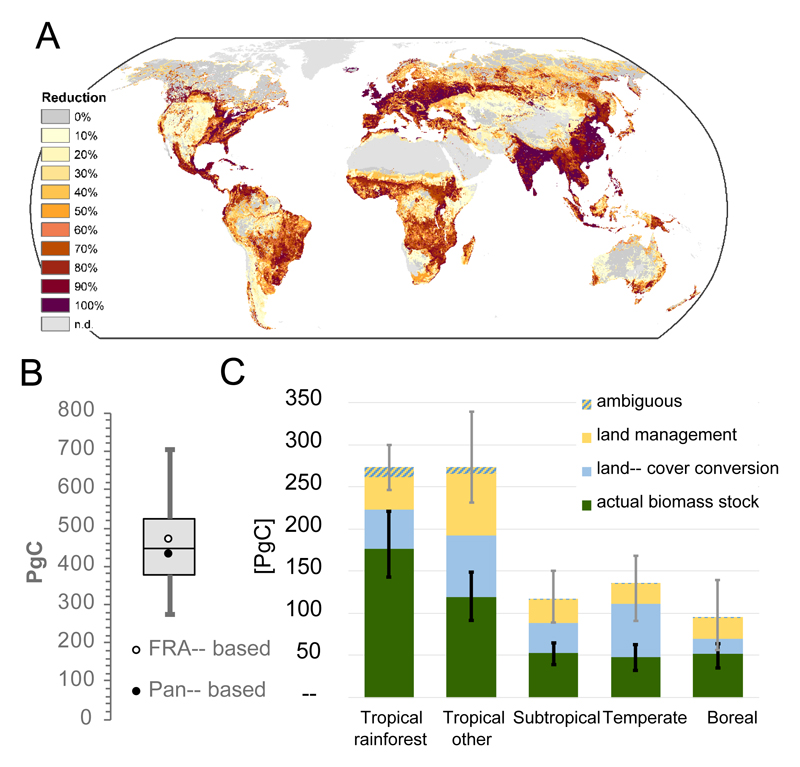
Fig. 1. Differences in biomass stocks of the potential and actual vegetation induced by land use.
A. Spatial pattern of land-use induced biomass stock differences (expressed in percent of potential biomass stocks), mean of all 42 estimates; B. Box plot of all 42 estimates. Whiskers indicate the range, the box the inner 50% percentiles, the line the median of all estimates; the two dots represent the results of the two approaches used for the attribution of biomass stock differences to land-cover conversion and land management. C. Actual and potential biomass stocks in the world’s major biomes (see Extended Data Figure 5f), and role of land-cover conversion and management in explaining their difference. Whiskers indicate the range of the estimates for potential (grey; n=6) and actual (black; n=7) biomass stocks.

