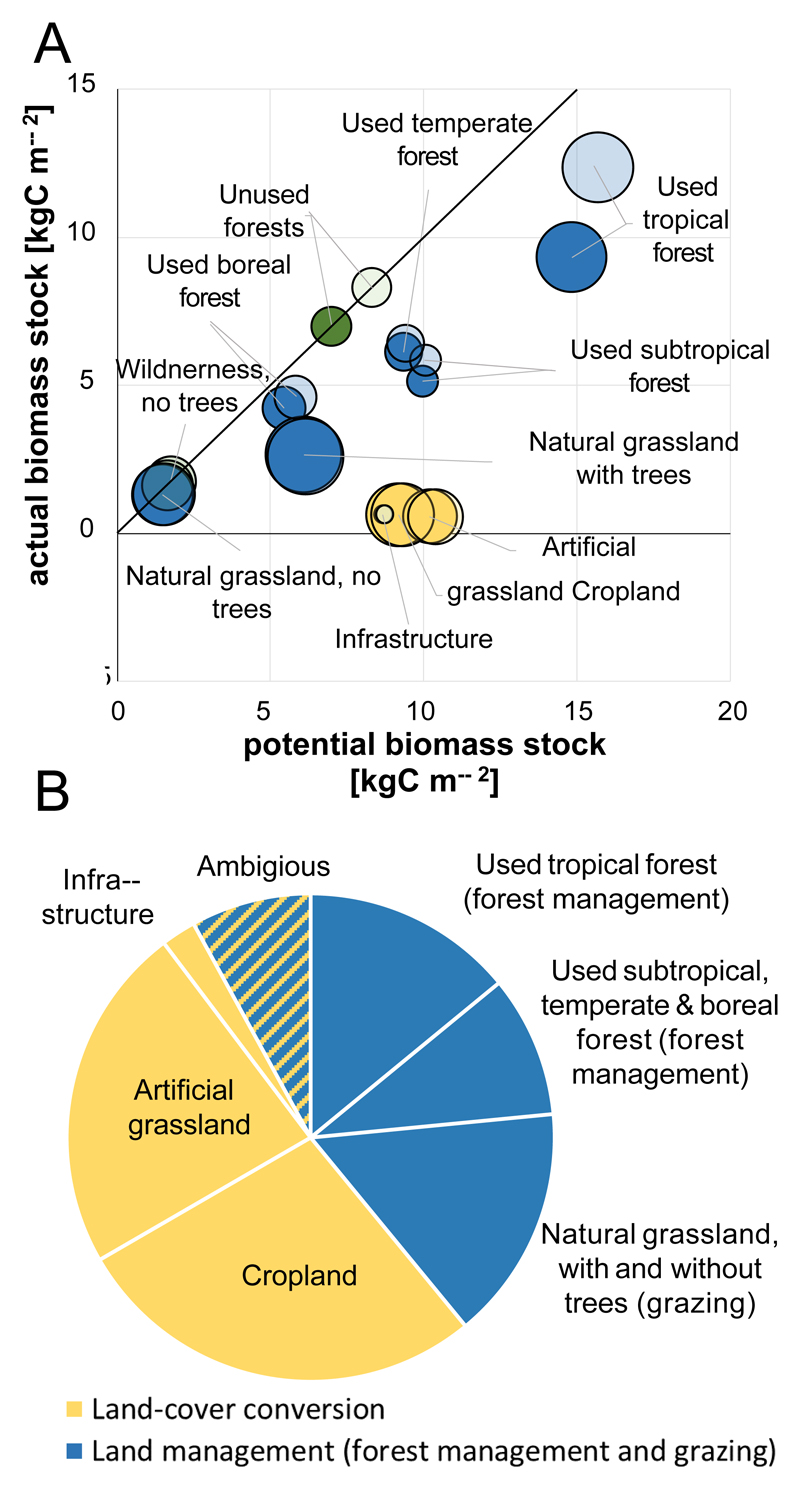
Fig. 2. Contribution of land-use types to the difference between potential and actual biomass stocks.
A. Potential and actual biomass stock per unit area per land-use type for the FRA-based (dark colors) and the Pan-based assessment (light colors). Circle size is proportional to the global extent of the individual land-uses. The diagonal line indicates the 1:1 relationship between actual and potential biomass stocks (no change, green color). B. Relative contribution of land-cover conversion and land management to the difference between potential and actual biomass stocks, based on the FRA-based and Pan-based assessments. “Ambiguous” denotes cases attributed differently in the two assessments (for absolute values refer to Extended Data Table 1).

