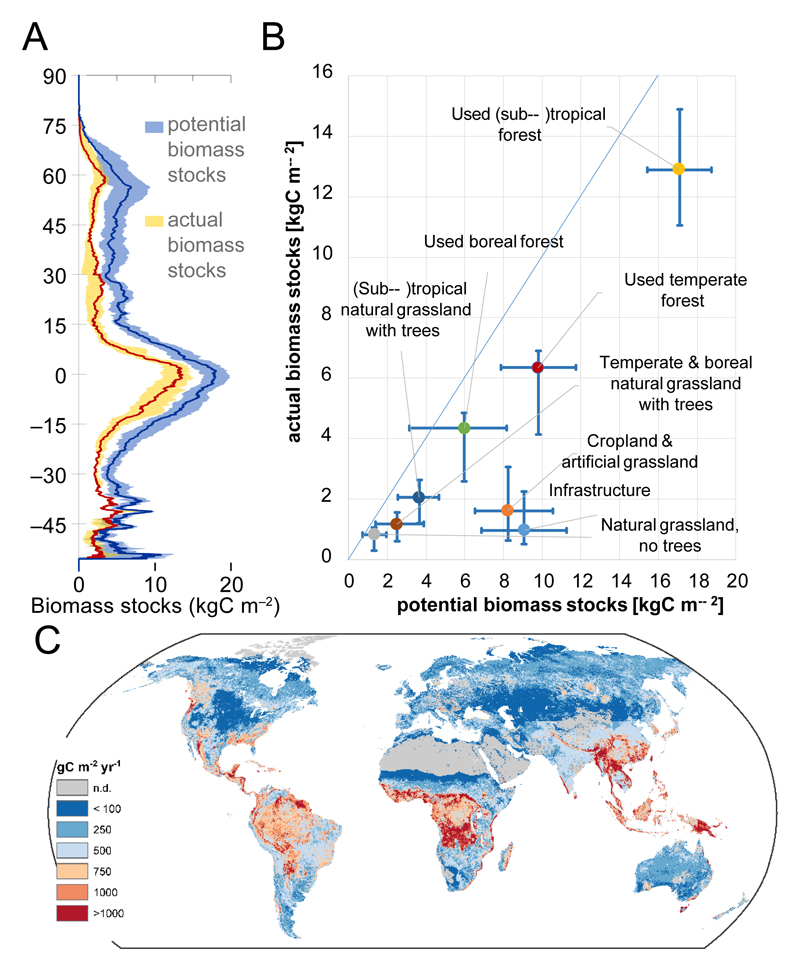
Fig. 3. Uncertainty of biomass stock estimates.
A. Latitudinal profile of all seven actual (yellow) and all six potential (blue) biomass stock estimates, the lines indicate the respective median, shaded areas the envelope (range). B. Ranges of potential and actual biomass stocks per land-use type, intersected at the median (n=6 for potential, n=7 for actual biomass stocks). In the absence of consistent land-use information for all layers, biomass stock changes were estimated on grid cells dominated (>85%) by a land-use type and thus slightly deviate from estimates displayed in Fig.2. The diagonal line indicates the 1:1 relationship where actual and potential biomass stocks are equal. C. Detection limit of annual changes in actual biomass stocks. Changes in biomass stocks need to exceed the detection limit in order to be detectable, e.g. in monitoring or stocktaking efforts such as foreseen in the Paris Agreement.

