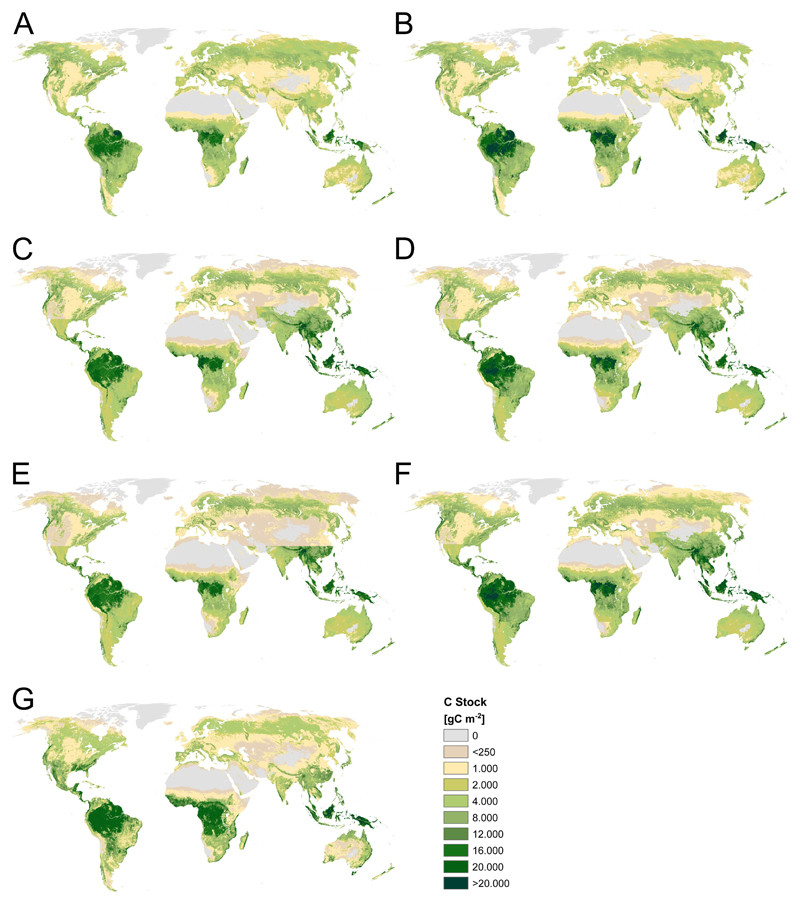
Extended Data Figure 3. Actual biomass stock maps used in the study.
Unproductive areas have been clipped from all maps. A) FRA-based, B) Pan-based, C) Saatchi-based, D) Baccini-based, E) Remote-sensing derived minimum, F) Remote sensing derived maximum, G) Ruesch & Gibbs 200848. For details and sources for maps A-F, see Method section.

