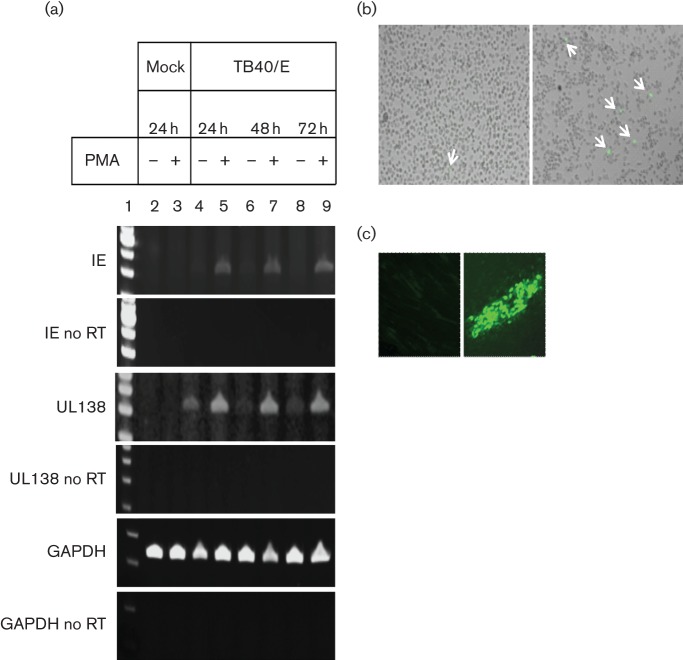
Fig. 3.
Characterization of the THP-1 latency and reactivation model in low serum. (a) THP-1 cells were infected with TB40/E at an m.o.i. of 5 and left for 3 days to obtain a latently infected population. Phorbol 12-myristate 13-acetate (PMA) was added on day 3 and left on the cells for 24, 48 or 72 h; cDNA was produced and amplified using IE, UL138 and GAPDH primers. Reverse transcriptase (RT) minus control samples (no RT) were run in parallel to exclude genomic DNA contamination. A representative experiment of three independent replicates is shown. Lane 1: 100 bp DNA ladder (Life Technologies); Lane 2: mock infected, untreated; Lane 3: mock infected, 100 nM PMA; Lane 4: TB40/E infected, untreated; Lane 5: TB40/E infected, 100 nM PMA; Lane 6: TB40/E infected, untreated; Lane 7: TB40/E infected, 100 nM PMA; Lane 8: TB40/E infected, untreated; Lane 9: TB40/E infected, 100 nM PMA. (b) Micrographs of TB40/E-infected, undifferentiated THP-1 cells (latency) (left panel) and TB40/E latently infected THP-1 cells, differentiated on day 3 post-infection with 100 nM PMA (reactivation) (right panel). (c) Cells from (b), left panel or right panel, were co-cultured with fibroblasts for 5 days (left panel or right panel, respectively). For all panels in (b) and (c), IE expression was visualized using immunofluorescence staining with anti-IE72/86 antibody. Arrows indicate IE-expressing cells.

