
Figure 6. Increased inner retinal neuron regeneration following SHH-N treatment in the light damaged retina.
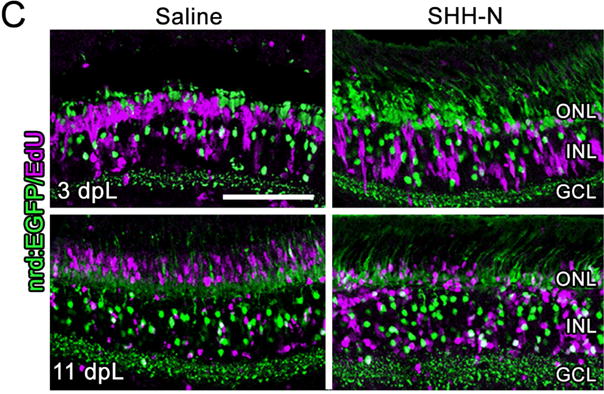
A) Nuclei are stained with TO-PRO-3 (blue). Compared with control retinas (top panel), SHH-N-treated retinas have a thicker INL. B) Graph depicting the number of nuclei in the ONL, INL, and GCL at 11 dpL. C) GFP expression in the Tg(nrd:egfp)/alb zebrafish line to show rod photoreceptors and a subset of INL cells (green) co-localized with EdU to label cells that re-entered the cell cycle (purple). EdU-positive cells largely remained in the INL of SHH-N treated retinas. D) Graph depicting the number of EdU-positive cells at 11 dpL in the INL and ONL. E) EdU immunofluorescence (red) co-localized with HuC/D (blue) or PKC (teal) in SHH-N treated retinas shows EdU-positive cell largely co-labeled with amacrine cells (framed with bar), and only isolated bipolar cells (arrow). Significantly different from control is noted with an asterisk (N=5–6 per treatment group per time point; p<0.05). Error bars represent standard error of the mean. ONL: outer nuclear layer. INL: inner nuclear layer. GCL: ganglion cell layer.