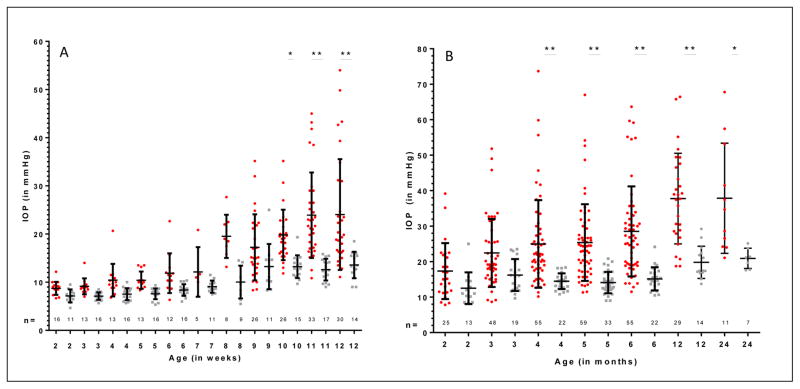
Figure 2.
A) Mean IOP values at weekly intervals during the first 12 weeks of age in normal and FCG cats. B) Mean IOP values at monthly intervals between 2 and 24 months of age in normal cats and FCG cats. The red dots represent data for individual FCG cats while the gray dots represent individual normal cats (many data points are superimposed) Error bars represent standard deviation. Statistically significant differences in mean IOP between normal cats and FCG cats for the same week (2A) or month (2B) are depicted by asterisks (*=p<0.05; **=p<0.001).

