Figure 1.
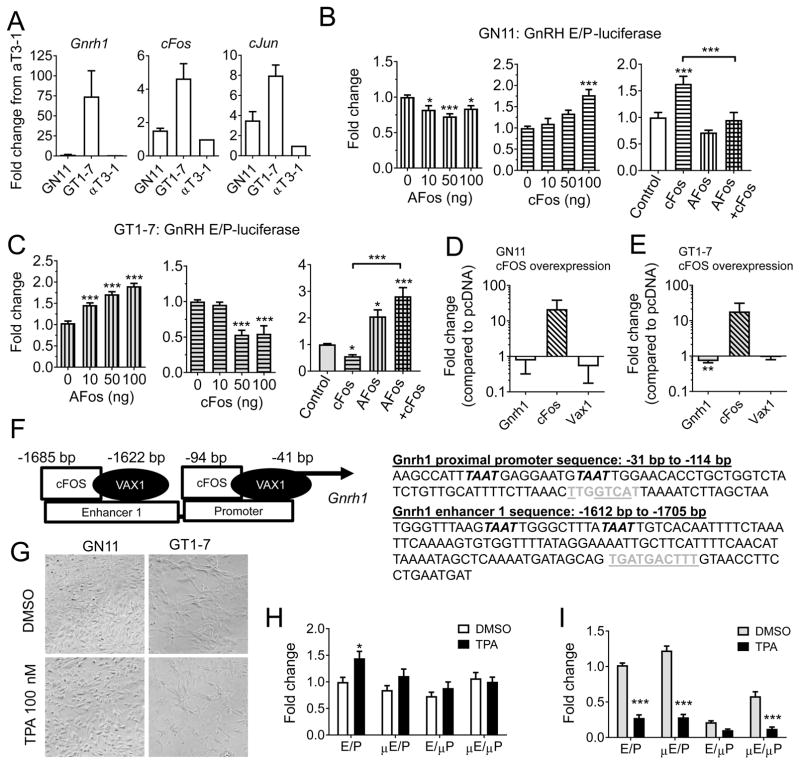
cFOS differentially regulates GnRH expression in immature and mature GnRH cell lines. A) Endogenous transcript levels of Gnrh1, cFos and cJun were evaluated by qRT-PCR in immature (GN11), and mature (GT1-7) GnRH cells, and the pituitary cell line αT3-1. B) GN11 (white) and C) GT1-7 (grey) cells were transiently transfected with a GnRH enhancer/promoter (GnRH E/P) luciferase construct, in the presence of a dominant negative cFOS plasmid called AFOS (vertical bars), cFOS (horizontal bars), or both (square pattern, AFOS 200 ng and cFOS 100 ng) and the fold change in luciferase levels evaluated. Data is expressed as fold change as compared to control. Statistical analysis by one-way ANOVA, followed by Dunnett’s multiple comparison test to for effects of either AFOS and cFOS, and a Tukey multiple comparison test for the dual treatment with AFOS and cFOS, * p < 0.05, ** p < 0.01, *** p<0.001, or as indicated by bracket, n = 3–5. D) GN11, and E) GT1-7 cells were transiently transfected with an empty vector (pcDNA) or cFOS, and endogenous levels of Gnrh1, Vax1 and cFos evaluated by qRT-PCR. Students t-test; * p > 0.05, n = 4–6. F) Location of ATTA (italic) and AP1-half sites (grey) in the GnRH E/P-luciferase construct. AP1-half sites mutated in G and H are underlined. G) Phase contrast image of GN11 and GT1-7 cells after 20 h DMSO or TPA 100 nM treatment (x20). H) GN11, and I) GT1-7 cells were transiently transfected with GnRH E/P-luciferase with or without AP1-half sites mutated in the enhancer (μE), the proximal promoter (μP) or both (μE/μP) and the capacity of TPA 100 nM to regulate its expression evaluated. Data is expressed as fold change compared to transcript levels in control (DMSO in GnRH E/P-luciferase). Statistical analysis by Two-way ANOVA followed by Sidak’s multiple comparison. * p > 0.05, *** p > 0.001 as compared to DMSO on the same construct, n = 4–6.

