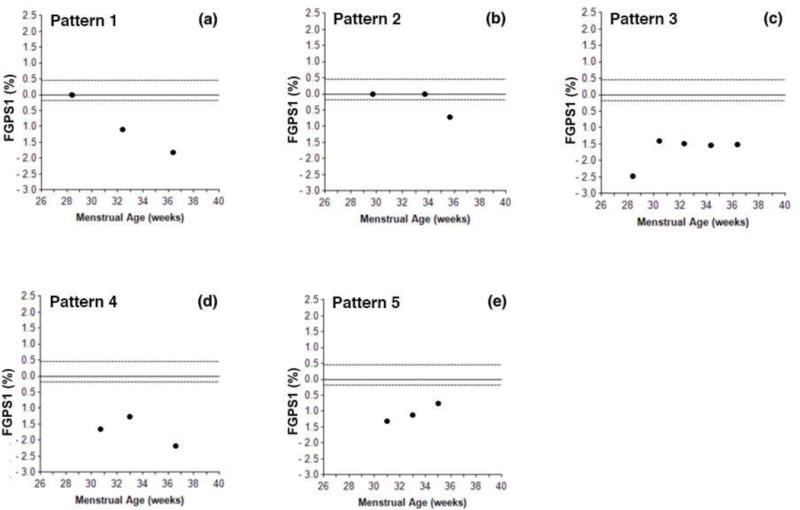
Figure 1. Third trimester Fetal Growth Pathology Score 1 [FGPS1] patterns in growth restricted fetuses.

This figure illustrates the five types of patterns found when serial FGPS1 measurements were plotted against fetal age at the time of scan. Pattern 1 showed FGPS1 values that became progressively more negative throughout the third trimester. Pattern 2 showed a single negative value at the last scan [70% were within two weeks of delivery]. Pattern 3 had an initial negative FGPS1 value that then leveled off and remained approximately constant. After the initial negative value, Pattern 4 showed evidence of recovery, followed by subsequent progression of the growth restriction process. In Pattern 5, the initial negative value was followed by continuous regression back toward normal during the rest of the third trimester.
