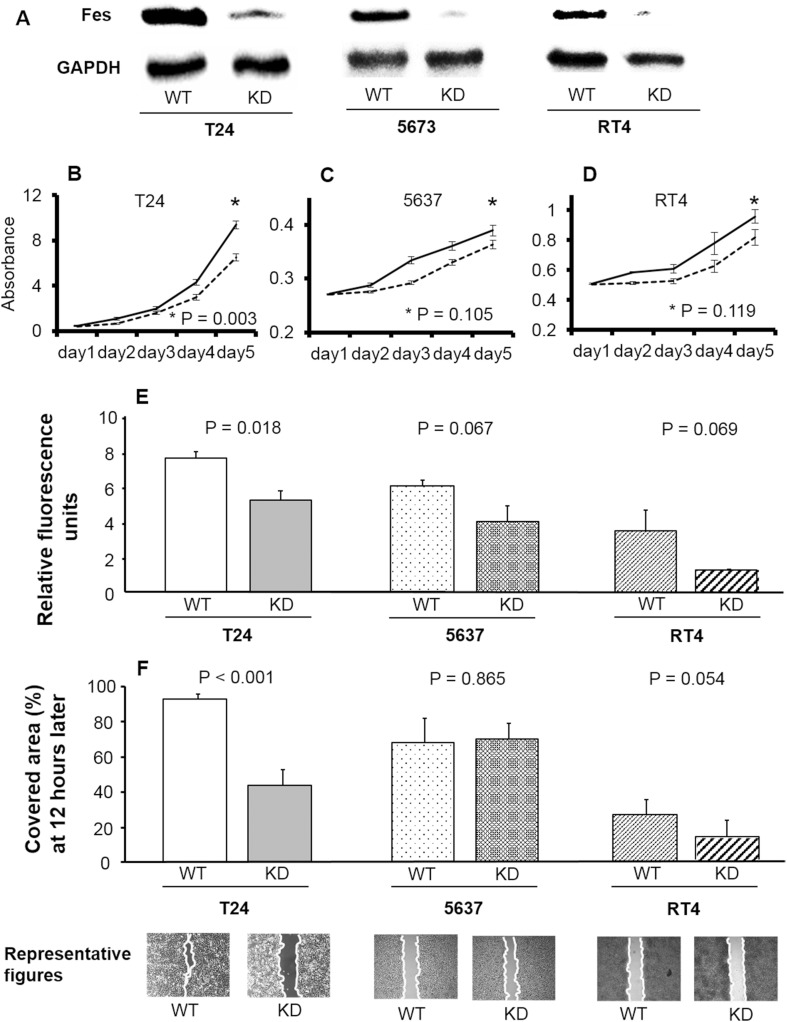
Fig. 1.
Pathological roles of FES in various bladder cancer cell lines. a FES expression in non-transfected and FES-KD cells. In all three lines, FES expression was remarkably decreased following KD. b–d Growth curves of cancer cells of each line. Cell proliferation was inhibited by KD of FES expression in T24 cells (b; corresponding to grade 3) (p < 0.001); however, no such effect was detected using 5637 cells (c; grade 2) or RT4 cells (d; grade 1). e Relative fluorescence representative of invasive cell number was lower following KD of FES expression in T24 but not 5637 or RT4 cells. f Similar results were obtained with a gap-closure assay used to evaluate cell migration. Briefly, inhibition of cell migration by FES-KD was detected in T24 (p < 0.001) but not 5637 or RT4 cells. Representative figures of the scratch assay in these cell lines 12 h later are also shown

