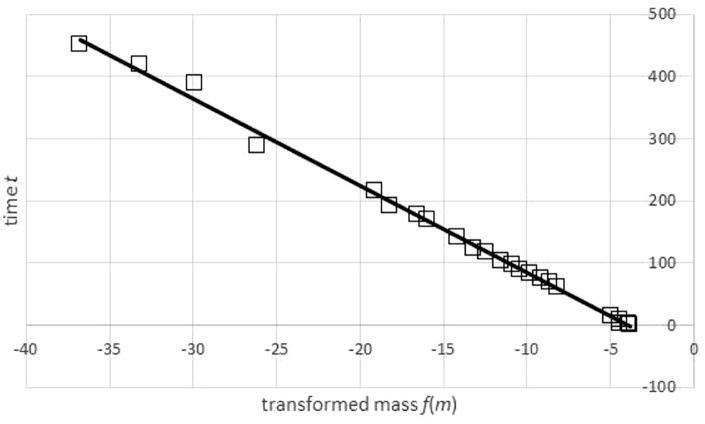
Figure 4. Transformation of time-mass-data and a regression line for the transformed data set.
Generalized Bertalanffy-Beverton plot generated in Microsoft EXCEL, based on data set #47; squares: transformation of data (t, m) into (u, t) = (f(m), t); line: regression line t = A + B⋅u with A = − 55.64 and B = − 14.03. The function f was defined in Eq. (3) using the exponent a = 0.83 and assuming an asymptotic weight limit mmax = 32, 163 g. The transformation required mmax to exceed the maximal observed weight (31.8 kg), as otherwise the transformation would not be defined for all data points.

