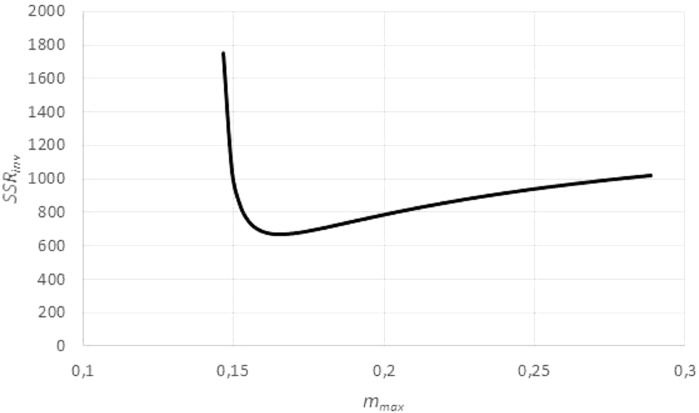
Figure 5. Optimizing the asymptotic weight limit (fit to weight-time data).
Figure generated in Microsoft EXCEL, based on data set #14, plotting the sum of squared residuals SSRinv (fit to the weight-time data) in dependency on mmax for an exponent a = 0.67. The minimum was attained for mmax = 0.165 g (maximal observed weight: mobs = 0.145 g) resulting in the estimates q = 0.1/day and m0 = 0.03 g. These were used as a starting value for the minimization of SSR (fit to the time-weight data). The resulting optimal parameters for a = 0.67 were q = 0.139/day, m0 = 0.002 g and mmax = 0.149 g.

