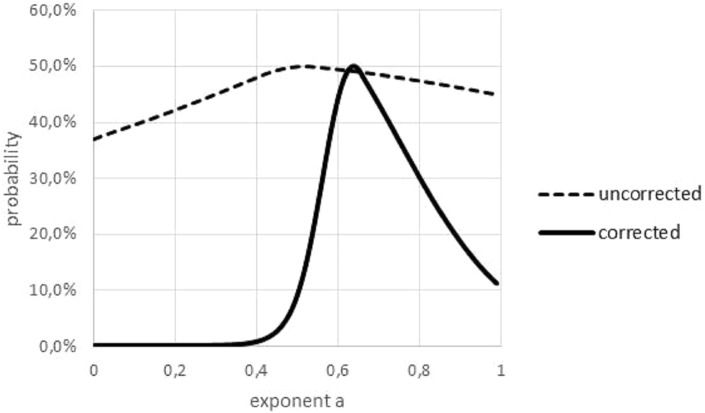
Figure 6. Akaike weights for different exponents, for data with and without outliers.
Graphical multi-model comparison, generated in Microsoft EXCEL, based on data set #10 with and without outlier. The Akaike weight prob(a) for model (1) with exponent a was computed in comparison with the optimal exponent; dashed/fat line Akaike weights for data with/without outlier. Without outlier, the optimal exponent became larger (0.64) and exponents with poor fit could be discerned more easily.

