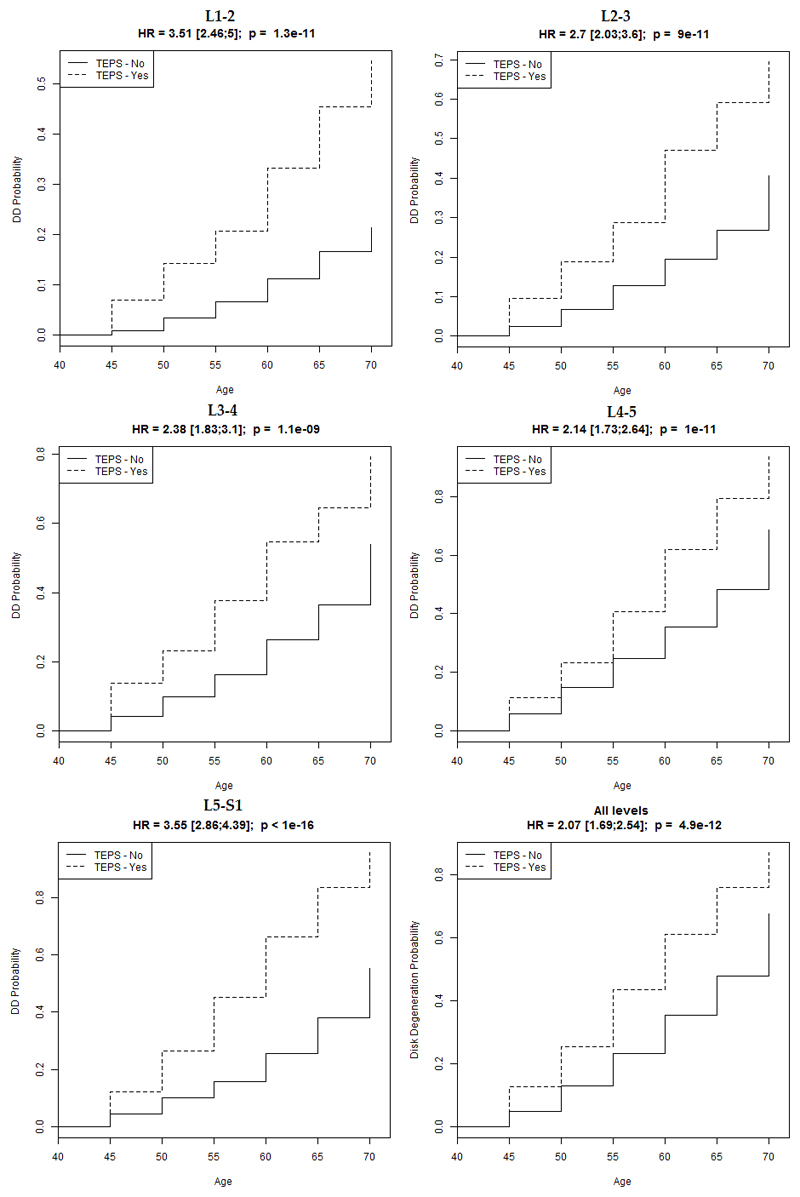
Figure 2.
Survival analysis paired with Cox proportional hazards models analysis. Probabilities of having DD are significantly increased with age in TEPS positive (≥5) subgroups at each disc level (denoted ‘TEPS – Yes’ in the Figure). The probabilities increase with age, and the influence of endplate defect is least at L4/L5. DD = disc degeneration by Pfirrmann, HR = hazard ratio, TEPS = total endplate score.

