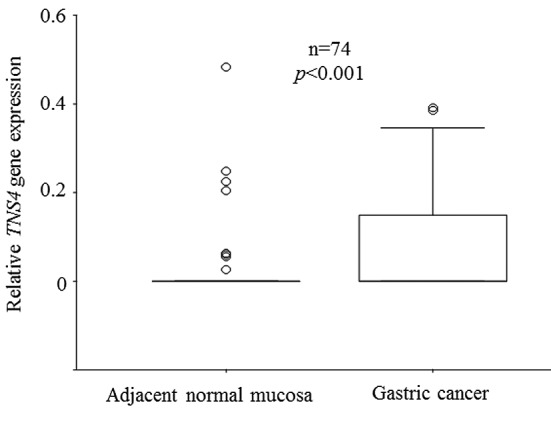
Figure 2. Comparison of tensin 4 (TNS4) expression between gastric cancer tissue and adjacent normal mucosa. Box boundaries: 25th and 75th percentiles of the observed values; capped bars: 10th and 90th percentiles; solid line: median; circle: outlier. p-Values were calculated by the Wilcoxon signed-rank test. TNS4 gene expression was significantly higher in cancer tissue than in adjacent normal mucosa (p<0.001).

