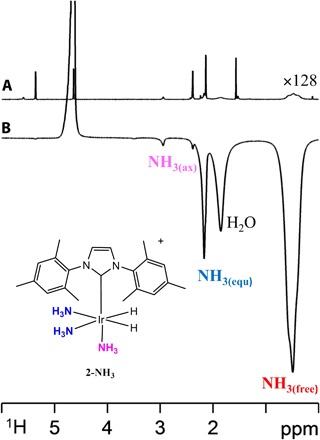
Fig. 1. Hyperpolarization of NH3 under SABRE.

(A) Thermally polarized control 1H NMR spectrum showing peaks for 2-NH3, NH3, and H2 at 298 K in dichloromethane-d2, ×128 vertical expansion relative to (B). (B) Corresponding single-scan 1H NMR spectrum in the presence of p-H2, with the hyperpolarized responses for H2O, NH3(free), Ir-NH3(equatorial), and Ir-NH3(axial) of 2-NH3 indicated.
